


AI & B2B SaaS companies save roughly 55% on total compensation hiring senior LATAM talent versus equivalent US hires. On cost per productive year, once retention enters the math, the gap widens past 60%.
Cost | Based on 1,200+ LatamCent placements, cross-referenced against 50,000+ verified US comp submissions | Last updated July 2026
Key findings
- Senior LATAM talent costs roughly 55% less in total compensation than an equivalent US hire, and past 60% once retention enters the math.
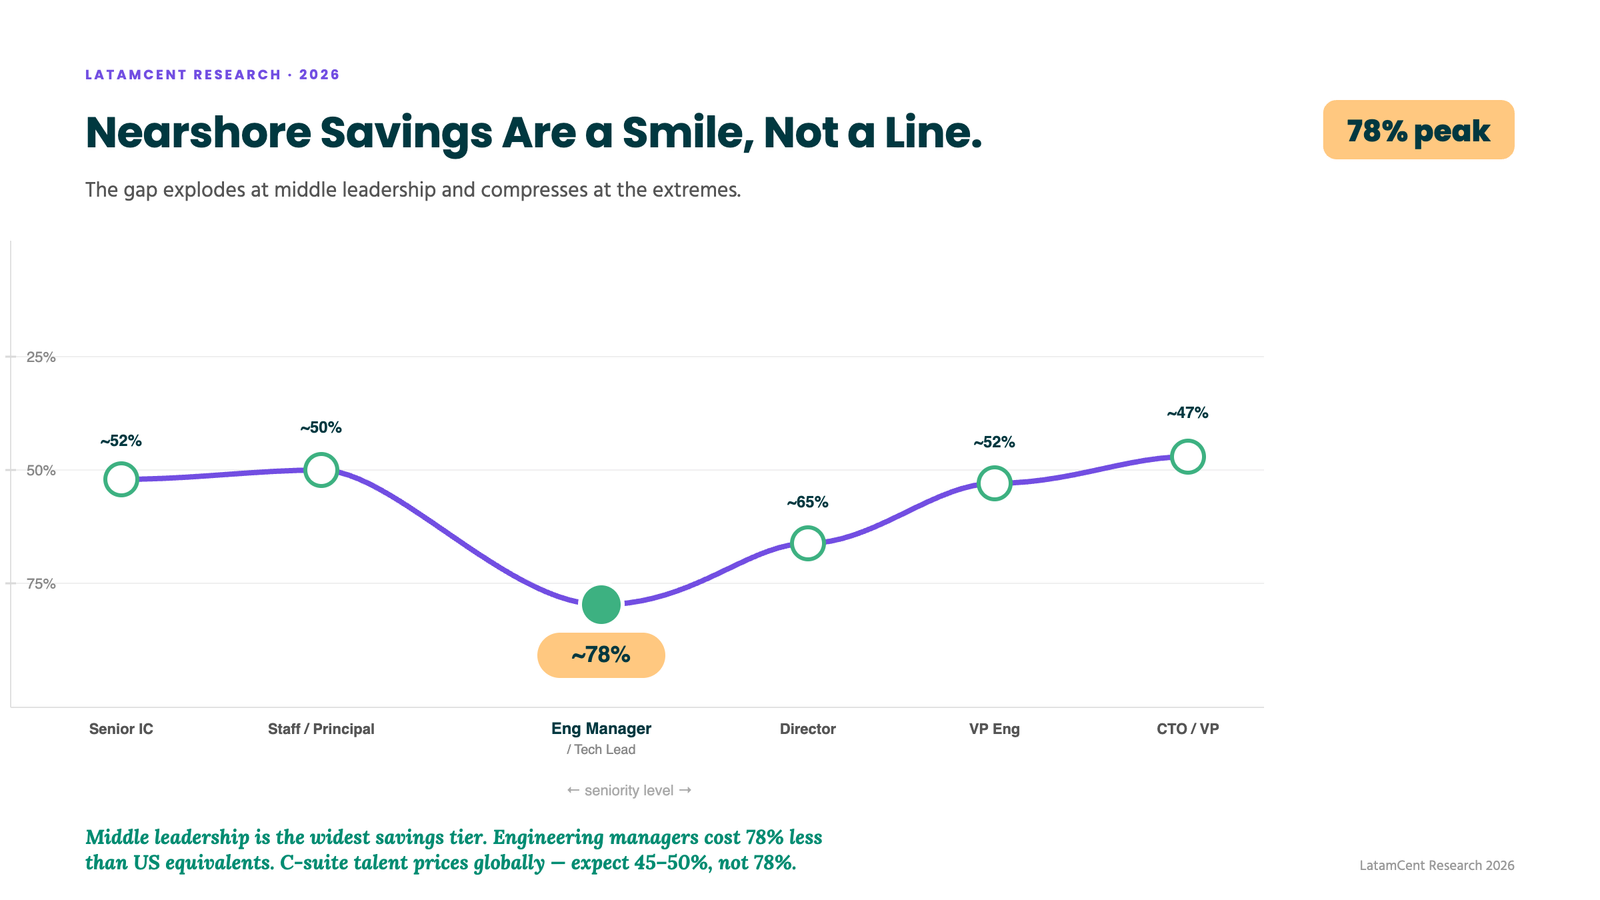
- The savings curve peaks at middle management: an Engineering Manager runs up to 78% below the US equivalent.
- Cost per productive year: about $260k (US) versus about $120k (nearshore) across a three-year window.
- Employer burden swings the math: Brazil CLT can add 1.6-1.8× base, versus 1.2-1.3× for an Argentina contractor.
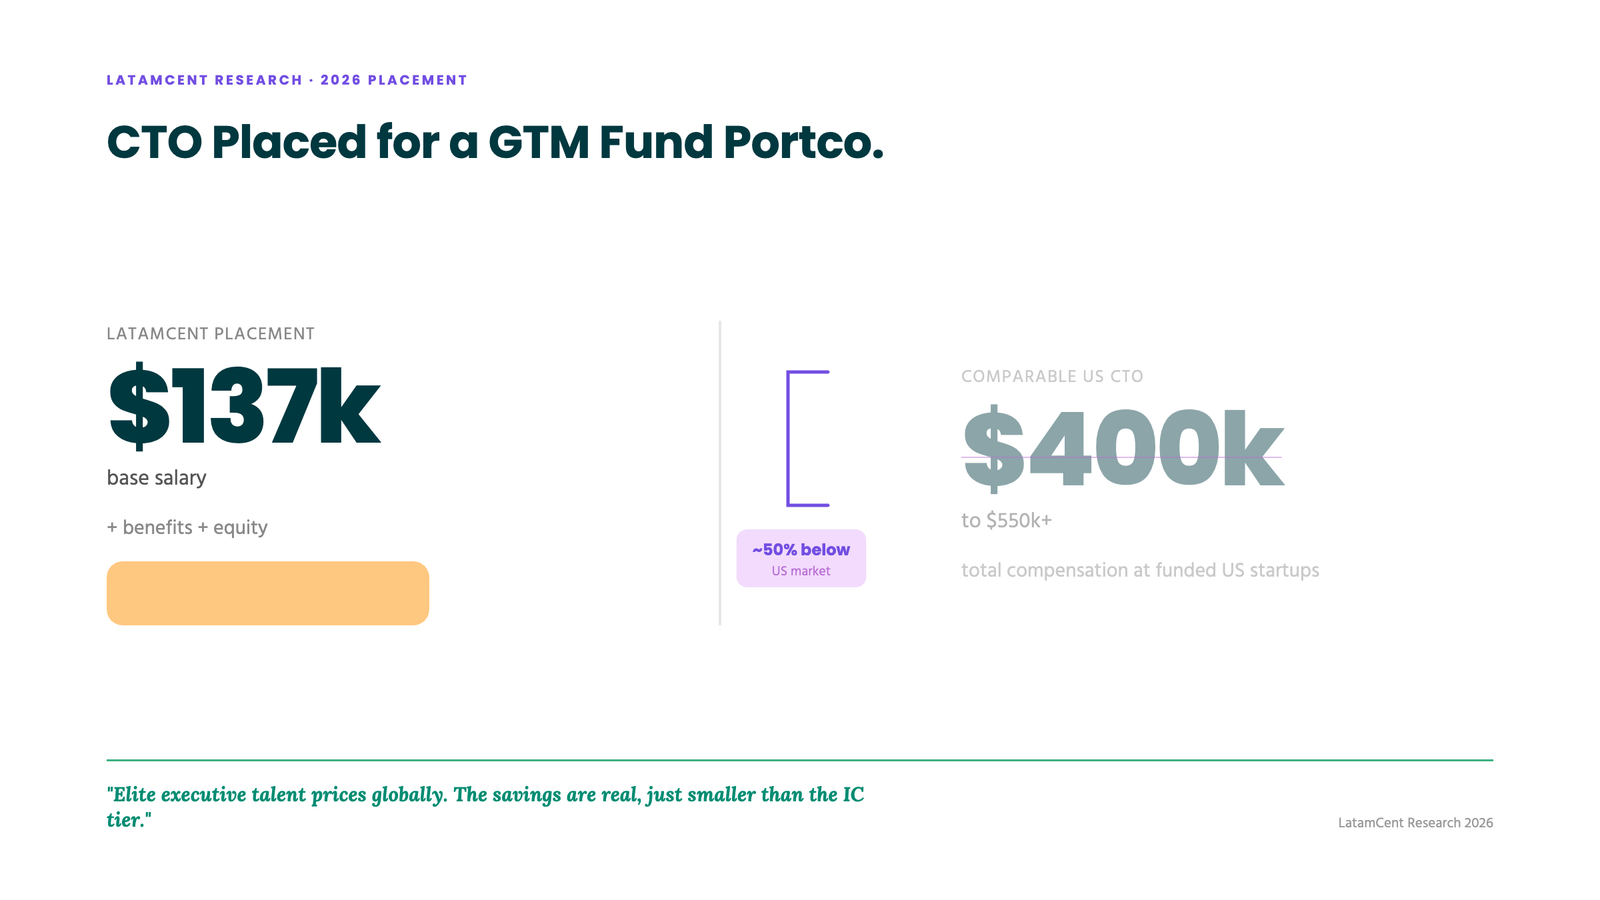
- A recent CTO placement landed at $137k base and roughly $250k total package, about 45-50% below a comparable US executive.
Every founder has run this math on a napkin. A senior engineer in Austin wants $170k base. Add benefits, payroll tax, and equity refreshes and you are past $220k fully loaded. Then the CFO asks why burn is up and headcount is flat.
I have placed hundreds of engineers, GTM operators, and finance professionals from Latin America into US AI & B2B SaaS companies. The napkin math is real, but most published savings numbers are marketing fiction. Agencies quote 70% by comparing a junior developer in Argentina to a staff engineer in San Francisco. That is not a comparison. That is a sales pitch.
So we did it properly: our placement data, same seniority and same hiring bar, checked against the largest verified US compensation datasets available in 2026. Here is what the gap actually looks like.
The real numbers, role by role
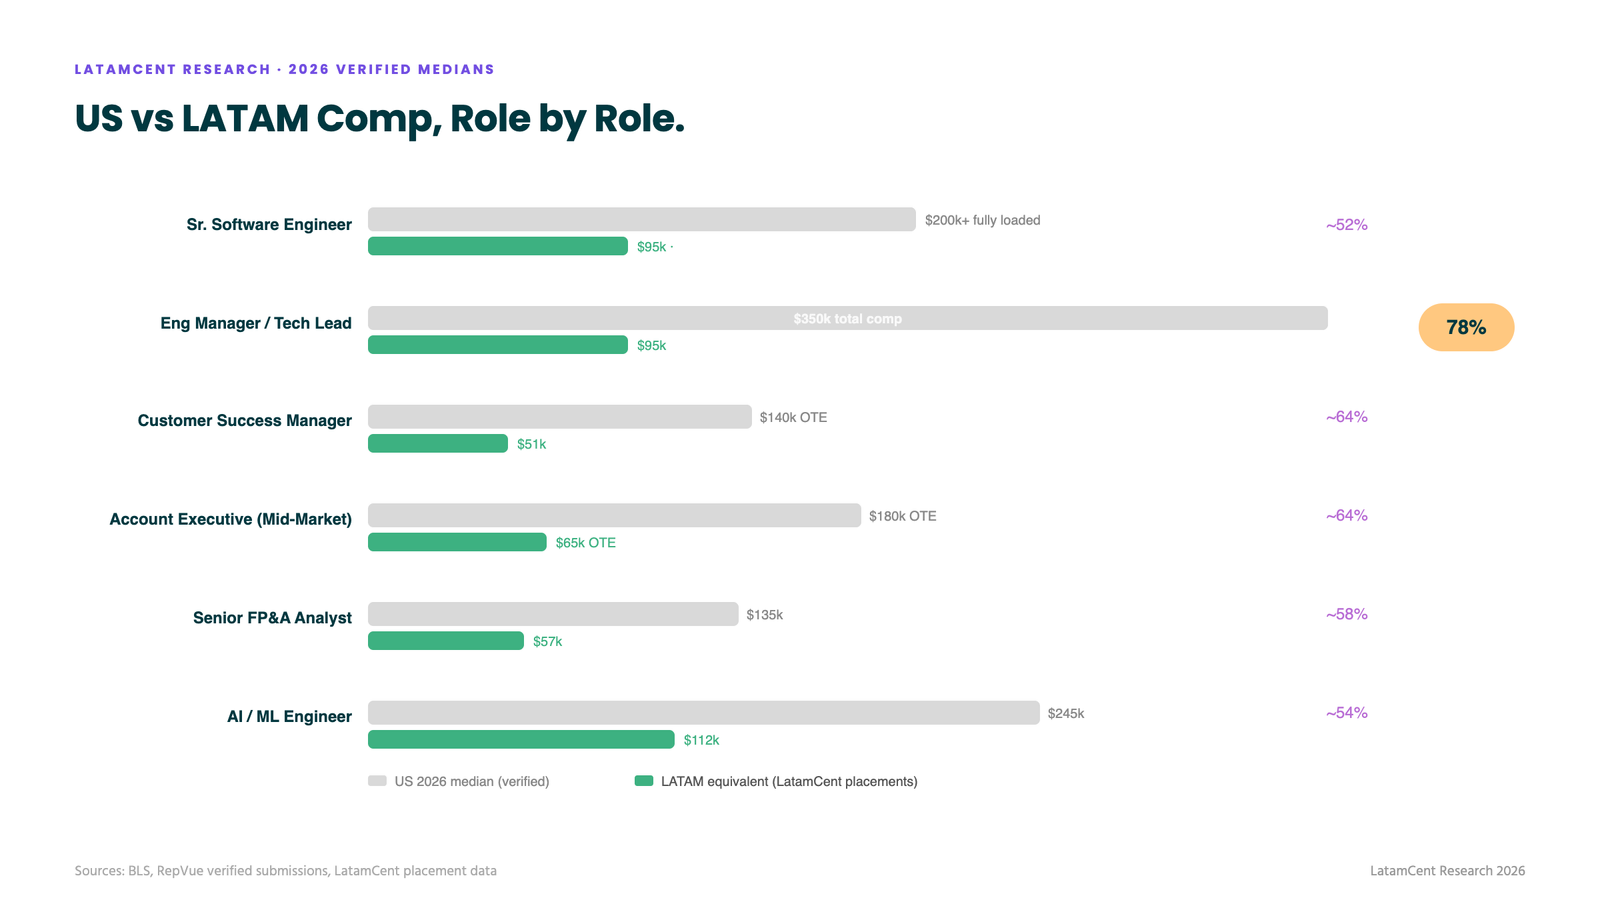
| Role | US benchmark (2026, sourced) | LATAM equivalent (LatamCent placements + market data) | Savings | Where the savings hold up |
|---|---|---|---|---|
| Senior Software Engineer | $133k median base across all US SWEs (BLS); $160k-$170k cash at funded AI & B2B SaaS companies; $200k+ fully loaded | $80k-$110k. LATAM back-end median hit $84k in Q1 2026, 90th percentile above $110k | ~50-55% | Holds at senior, narrows for staff+ |
| Engineering Manager / Tech Lead | ~$350k total comp at US tech companies | $90k-$100k for equivalent scope | Up to 78%, the single largest gap in tech | Middle leadership is the hidden arbitrage |
| CTO / VP Engineering | $400k-$550k+ total comp at funded US startups | $137k base, ~$250k total package with benefits and equity (recent LatamCent placement) | ~45-50% | Gap compresses at the top. Elite executive talent prices globally |
| Customer Success Manager | $105k median base, $140k median OTE (1,386 verified US submissions) | $42k-$60k all-in | ~57-60% | Largest volume opportunity of any function |
| Account Executive (mid-market) | $92k median base, $180k median OTE (12,000+ verified submissions) | $55k-$75k OTE | ~58% on OTE | Base gap large; commission structures converge |
| Senior FP&A Analyst | $120k-$150k at funded AI & B2B SaaS companies | $48k-$66k | ~57% | Underhired arbitrage. Almost nobody knows it exists |
| AI/ML Engineer | $210k-$280k, frontier offers far higher | $95k-$130k | ~50% | Smallest gap. LATAM AI talent knows its market value |
Two things in this table that no competitor publishes. First, the savings curve is a smile, not a line: the gap explodes at middle leadership, where an Engineering Manager runs to 78% below the US equivalent, then compresses at both extremes. At the AI frontier and at the executive tier, elite talent prices globally. We recently placed a CTO at a GTM Fund portfolio company: $137k base salary, roughly $250k total package once benefits and equity are counted. That is still ~45-50% below a comparable US CTO package, but it is not the 78% of the EM tier, and anyone promising 78% on an executive search is selling you a fiction. Second, the US numbers are verified market medians, not strawmen. We are comparing against what companies actually pay, per tens of thousands of verified 2026 comp submissions, not against a Bay Area outlier chosen to flatter the gap.
The multiplier nobody prices: employer burden by country
Base salary is not cost. What you actually pay depends on the employment structure, and it varies wildly by country:
| Country | Typical senior eng cash comp | Common structure | Employer burden on top of comp | What changes the math |
|---|---|---|---|---|
| Argentina | ~$63k avg mid-senior, more for top decile | Contractor | ~1.2-1.3× total | Lowest-friction structure in the region |
| Colombia | $35k-$70k senior range | Contractor or direct | Contractor lean; direct employment adds statutory benefits | Medellín and Bogotá price below Brazil for equal skill |
| Brazil | Largest talent pool, São Paulo commands premium | CLT direct employment or contractor | CLT runs 1.6-1.8× base if you employ directly | The country where DIY hiring most often blows the budget |
| Mexico | Competitive mid-level, strong senior supply | Direct or contractor | Statutory benefits add materially under direct employment | Closest timezone alignment to US Central |
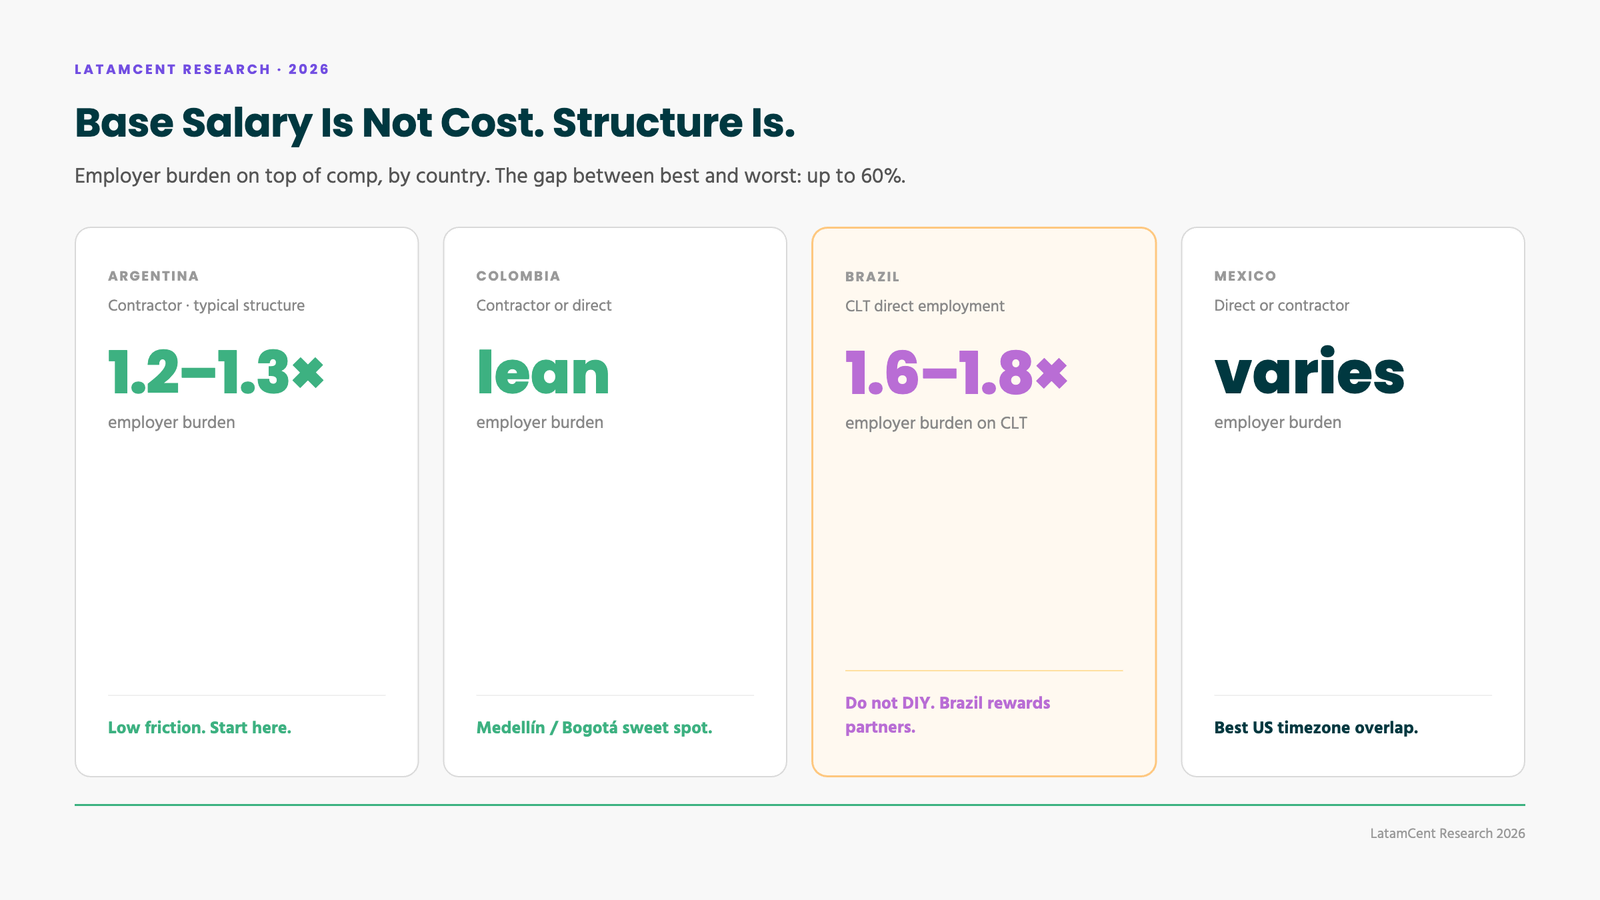
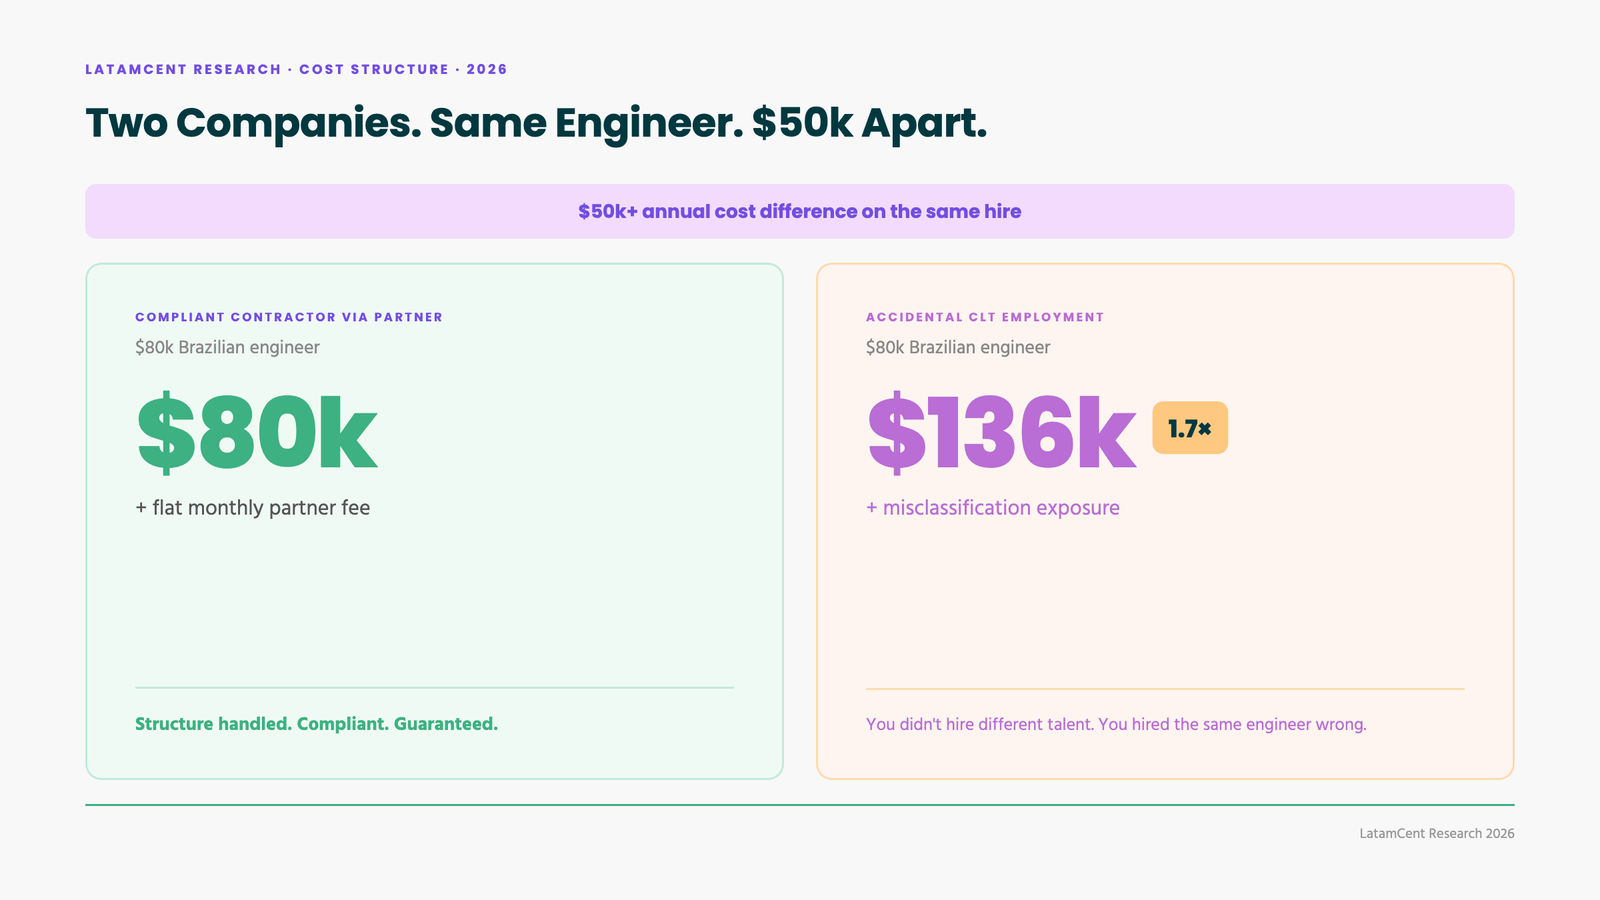
This is why two companies hiring the “same” $80k Brazilian engineer can have a $50k annual cost difference. One is paying a compliant contractor rate through a partner. The other accidentally created a CLT (Consolidação das Leis do Trabalho, Brazil’s statutory employment regime) employment relationship and is paying 1.7× with misclassification exposure on top. Through LatamCent the structure, compliance, and payroll are bundled into one flat all-in number, so the multiplier is our problem, not yours.
LATAM salaries are rising. That is a feature.
Get ahead of the objection: LATAM comp climbed across every role and every percentile through 2025 into 2026. The regional back-end median moved roughly $79k to $84k in a single quarter. Annual raise budgets in Colombia (6%), Mexico (5.4%), and Brazil (5.3%) are all running above the projected 3.7% US pace.
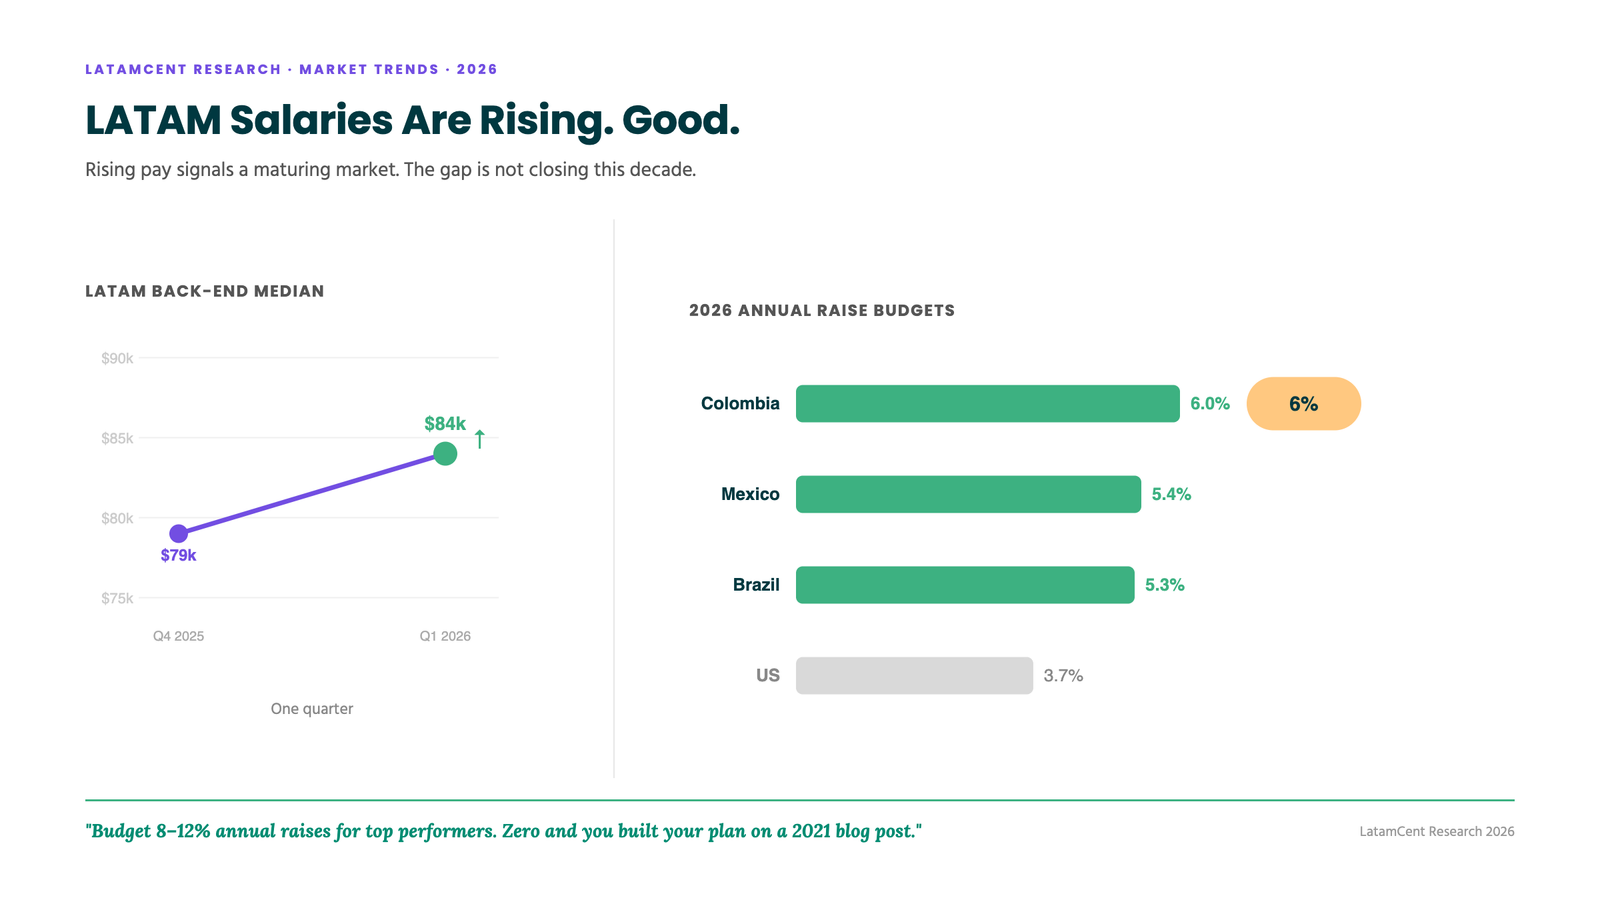
Read that correctly. Rising salaries in a talent market signal maturity: professionals with options, staying in the workforce, attracting serious investment. A market with flat wages and no competition for talent is a market you should worry about. And the strategic point holds: the differential with US salaries is not closing fast enough to change the calculus this decade. What is gone is 2021 pricing. Budget 8-12% annual adjustments for top performers and you will retain them; budget zero and you built your plan on a blog post from three years ago.
The number that actually matters: cost per productive year
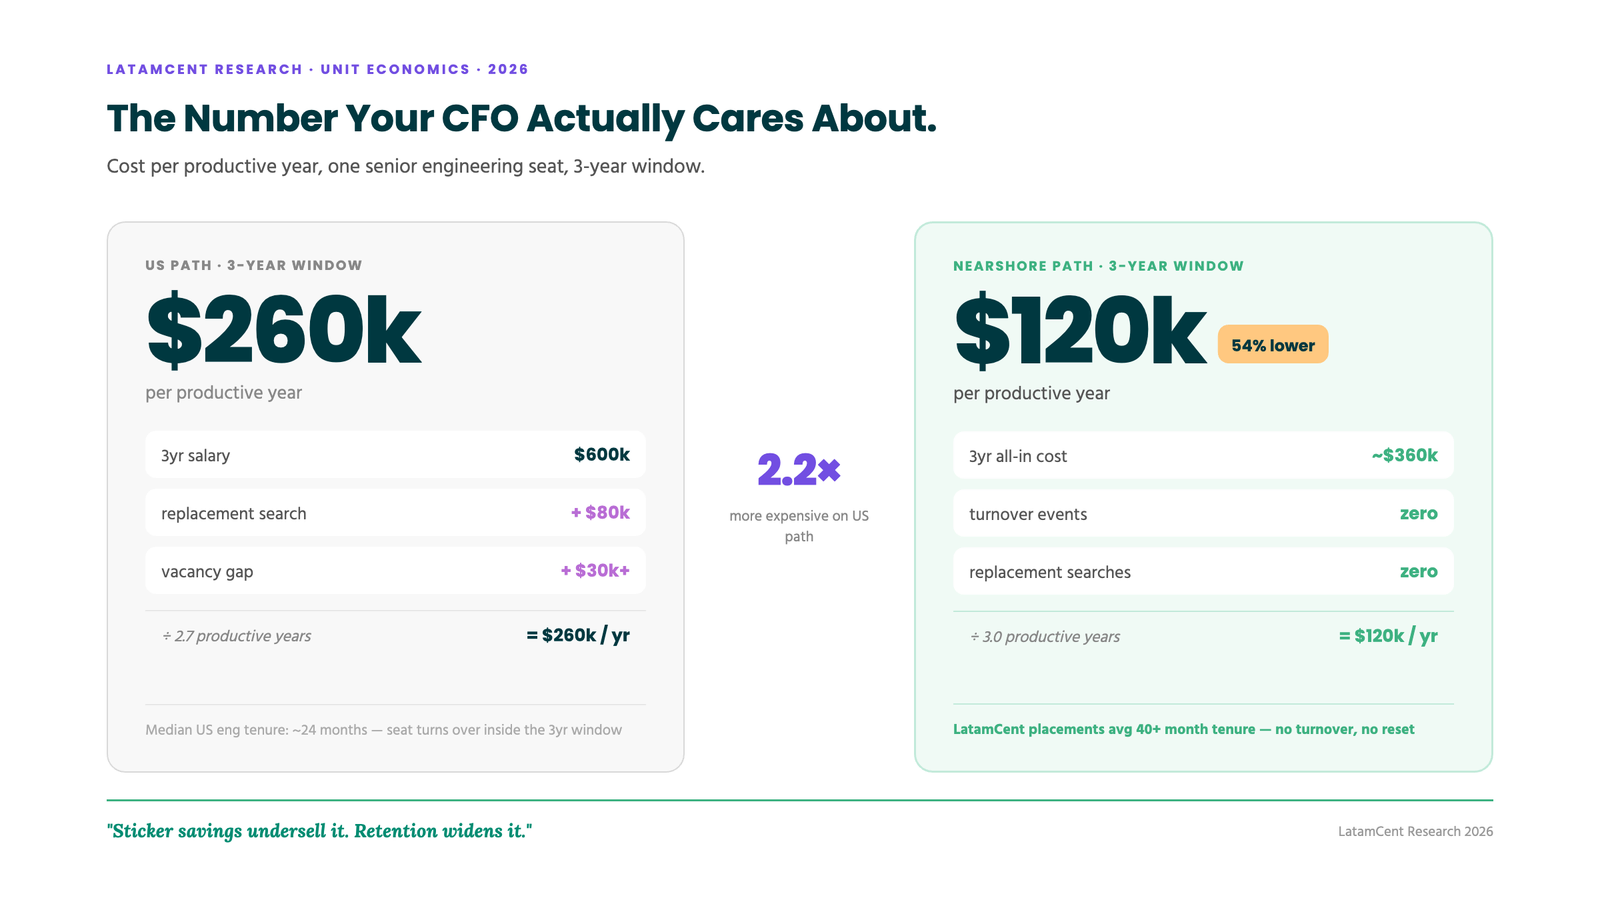
Sticker savings undersell the real gap, because US hires also leave faster. Run a 3-year window on one senior engineering seat:
US path. ~$200k fully loaded per year, so $600k over three years. Median engineering tenure at US SaaS companies is about 24 months, so the seat turns over once inside the window: add a replacement search (30-50% of salary), plus a 60-90 day vacancy at $10k+ per month in lost output. Total: roughly $700k+ for about 2.7 productive years. Call it ~$260k per productive year.
Nearshore path. ~$9k-$10k per month all-in through LatamCent, salary, payroll, compliance included: roughly $115k-$125k per year with performance raises. Our placements trend past 40 months tenure (see our retention study), so the seat does not turn over in the window. Total: ~$360k for three full productive years. Call it ~$120k per productive year.
That is a 54% reduction on the conservative math, widening past 60% once you price mis-hire probability and the second replacement cycle most US seats eventually hit. Independent nearshore placement research lands in the same zone: average savings of $35k-$64k per role per year, with LATAM hires staying 66% longer than US equivalents. Different dataset, same conclusion.
What this means for a real hiring plan
A 30-person AI & B2B SaaS company adding 5 roles (2 senior engineers, 1 CSM, 1 AE, 1 FP&A analyst) spends roughly $800k-$950k per year fully loaded in the US at 2026 verified market rates. The same team through LatamCent: $340k-$420k all-in, with a replacement guarantee on every seat.
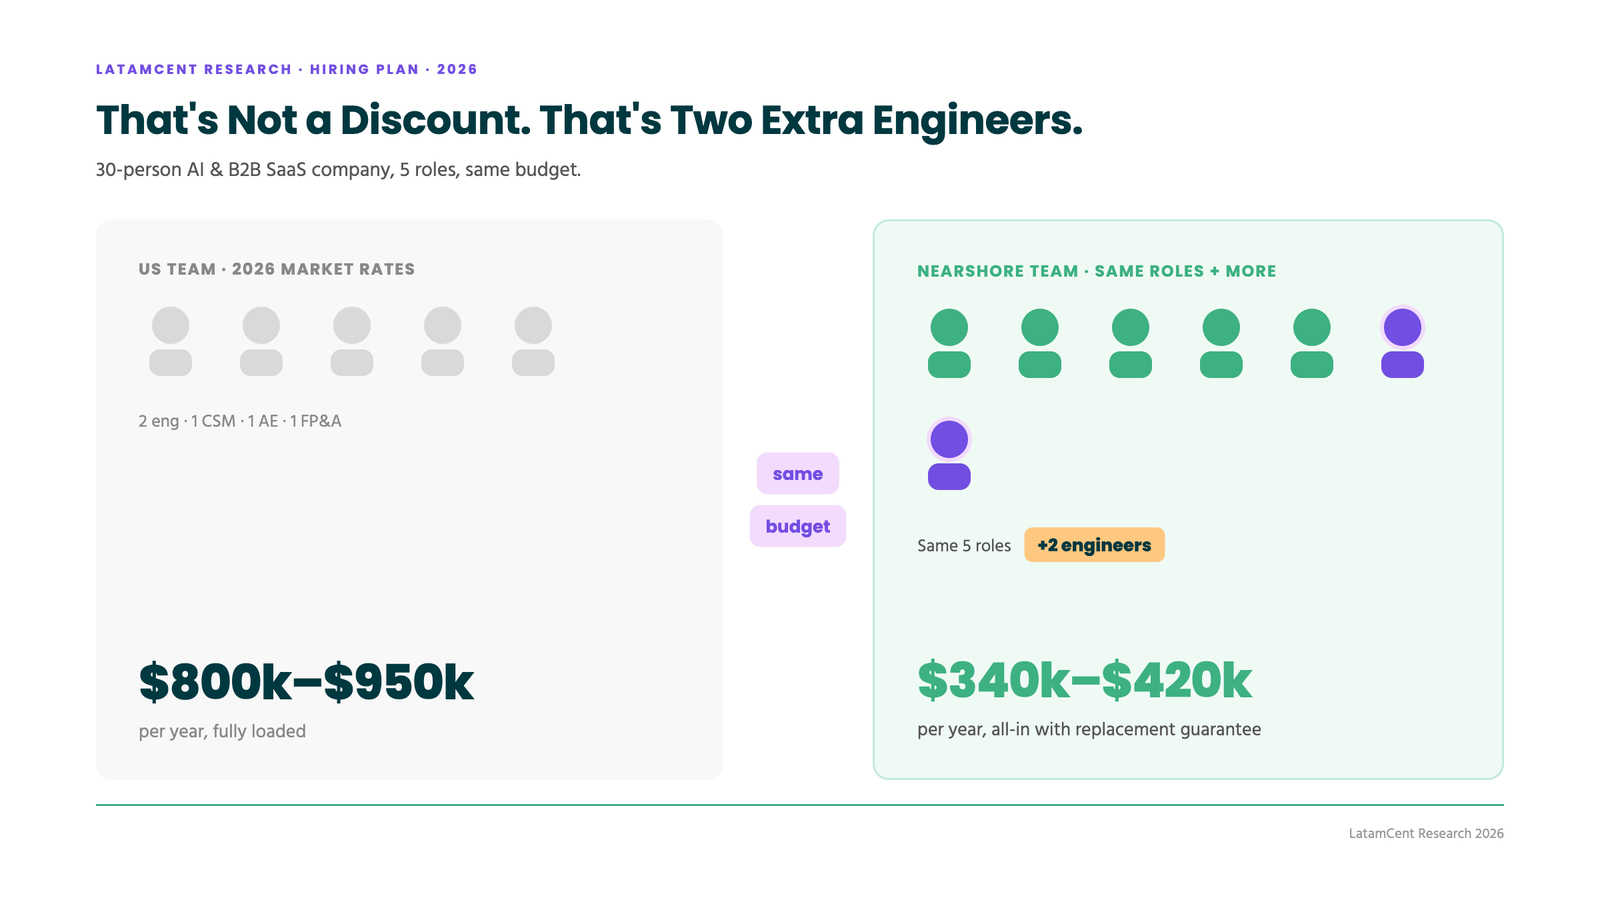
That is not a discount. That is two extra engineers on the same budget, or 12 more months of runway, before counting the retention effect.
Nearshore vs offshore: how the cost math changes
On sticker rate, offshore hubs like India can look cheaper than LATAM. On total cost, they usually are not: coordination drag, rework, and the 4.6-month ramp erode the gap, and the timezone offset removes the real-time collaboration that makes senior hires productive. We break the full comparison down in our nearshore vs offshore study.
Methodology
LATAM figures reflect actual accepted offers from LatamCent placement data across 1,200+ analyzed placements at US AI & B2B SaaS companies with 30-1,000 employees, corroborated by published LATAM placement reports tracking compensation by role and percentile through Q1 2026. US benchmarks: Bureau of Labor Statistics median base pay for software engineers; verified compensation submissions from RepVue (34,000+ account executives, 12,000+ mid-market AEs, 1,300+ customer success managers as of June 2026); and published engineering compensation data for venture-backed software companies. Employer burden multipliers from published nearshore payroll data (Brazil CLT 1.6-1.8×, Argentina contractor 1.2-1.3×). Cost-per-productive-year model uses US median tenure of ~24 months for SaaS engineering roles and LatamCent placement tenure from our retention study.
Ready to run the math on your open roles? A senior LATAM engineer through LatamCent costs roughly $9k-$10k/month all-in, salary, payroll, and compliance included, with a replacement guarantee. Compare that against your last US offer letter. Book a free hiring call at latamcent.com and we will benchmark your exact roles against 2026 market data.
This study is part of our Research & Insights series.
Cite this research
Found this useful? You are welcome to cite or link this study. Suggested citation:
LatamCent. "How Much Do AI & B2B SaaS Companies Save Hiring Nearshore? (2026 Data)" Research & Insights, LatamCent, 2026, https://latamcent.com/research-insights/nearshore-hiring-cost-savings/.