


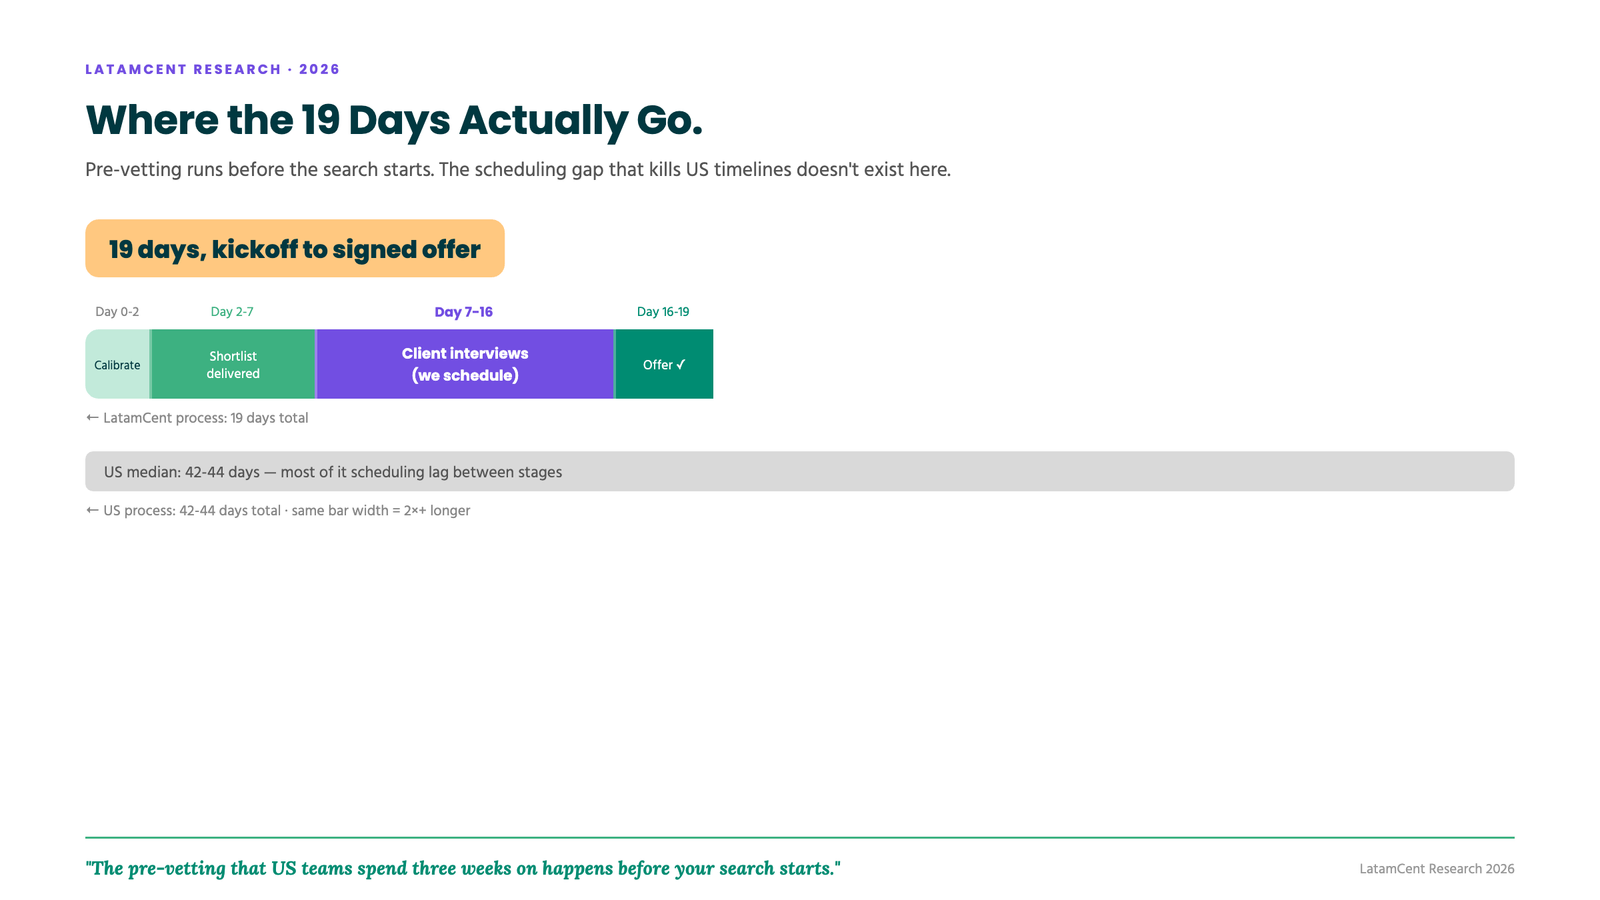
AI & B2B SaaS roles fill 3× faster through a nearshore pipeline. Median time-to-hire across LatamCent placements: 19 days, against a US market average of 42-44 days that has gotten 24% slower since 2021.
Speed | Based on 1,200+ LatamCent placements, benchmarked against SHRM, LinkedIn, and Workable industry data | Last updated July 2026
Key findings
- Median time-to-hire across LatamCent placements is 19 days, versus a US average of 42-44 days.
- Nearshore fills run about 3× faster, and AI/ML roles reach ~4.5×.
- H1 2026 offer acceptance was 88% (46 of 52 offers accepted).
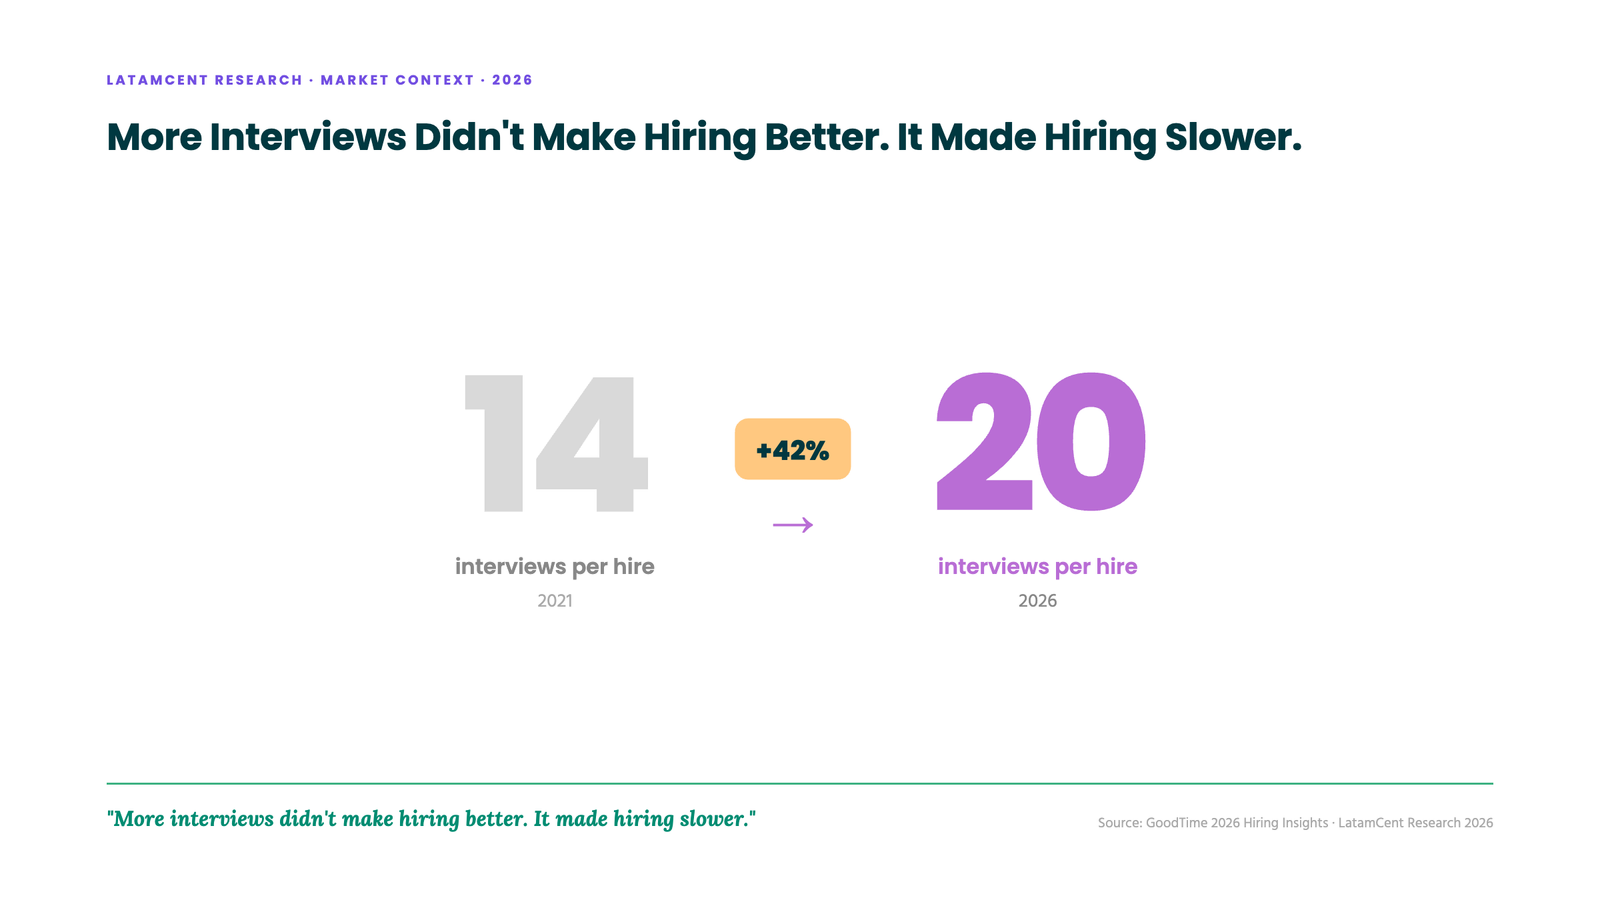
- US interview loops now average 20 interviews per hire, up 42% since 2021.
- SHRM puts the cost of an open role at $400-$1,500 per day in lost productivity.
An open role is not neutral. It costs money every day it stays open. SHRM puts the cost of vacancy at $400-$1,500 per day in lost productivity for professional roles. We have modeled it with clients: a revenue-touching or engineering role that sits unfilled past 180 days costs the business $10k+ per month in lost output, delayed shipping, and team drag.
And the US market is moving in the wrong direction. Average time-to-fill is now 42-44 days per SHRM’s benchmarking data, up 24% since 2021. Technology and engineering roles run 55-62 days per LinkedIn Talent Insights, with senior tech searches averaging 71 days. In 2024, 60% of companies reported their hiring got slower; only 12% got faster.
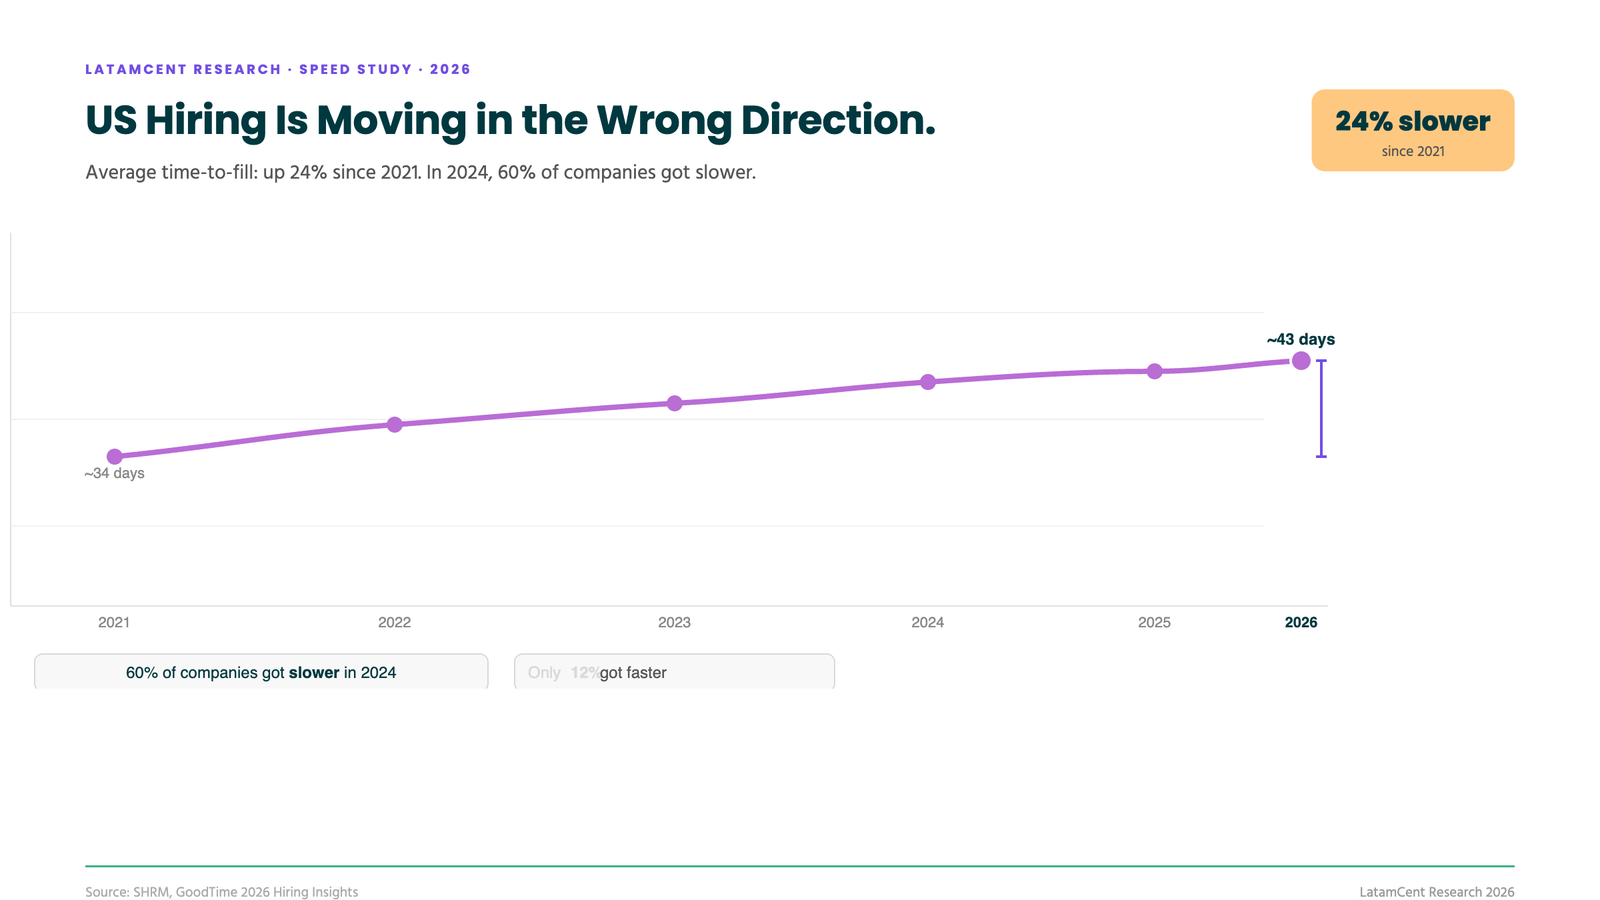
The US hiring problem is not a talent shortage. It is a pipeline problem. Every company in your metro is fishing the same pond with the same LinkedIn Recruiter licenses, and running 20 interviews per hire to do it, up 42% from 14 in 2021.
We track time-to-hire on every placement. Here is what the data says.
The speed gap, by role family
| Role family | US benchmark (sourced) | LatamCent median time-to-hire | Speed multiple | Why the gap exists |
|---|---|---|---|---|
| Back-End / Full-Stack Engineering | 55-62 days (LinkedIn Talent Insights); senior searches avg 71 days | 18 days | ~3.5× | Pre-vetted bench, no cold sourcing lag |
| AI/ML Engineering | 90-120 days; 72% of employers report they cannot find the skills | 21 days | ~4.5× | US market gridlocked, LATAM pool undertapped |
| Customer Success | 34-45 days | 14 days | ~3× | Deepest LATAM supply of any function |
| GTM / Sales | 38-50 days | 17 days | ~2.5-3× | English screening filters fast |
| Finance / FP&A | 44-46 days | 19 days | ~2.5× | Almost zero competition for this talent |
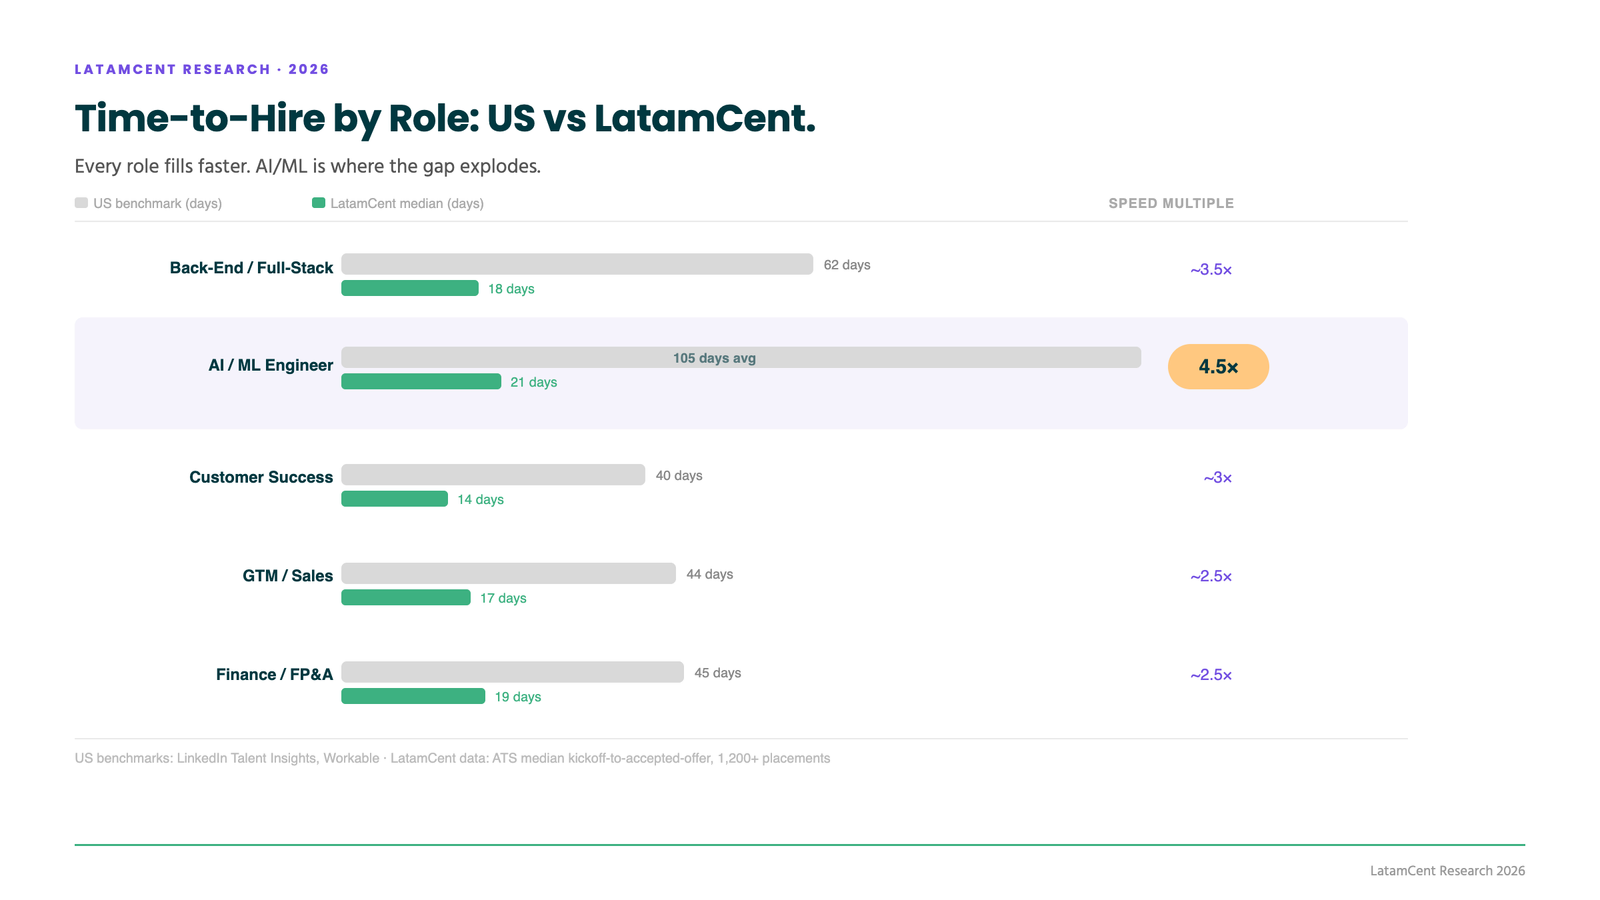
Median across all placements: 19 days from kickoff to accepted offer, against a market where the top quartile of US companies barely breaks 25 days and the median sits past six weeks.
The last column is the mechanism, and it matters more than the multiple. Speed does not come from lowering the bar. It comes from removing the slowest stages of US hiring entirely.
Where the time actually goes
Stage-level data explains the whole gap. In a typical US process, the single largest delay is the scheduling gap between screening and first interview: 7-14 days of dead time while hiring managers’ calendars stay full. The cumulative interview loop (scheduling, interviews, debriefs, decisions) eats 50-65% of total hiring time. Add the 42% inflation in interview volume since 2021 and the math writes itself: US searches are slow because the process got heavier, not because candidates got scarcer.
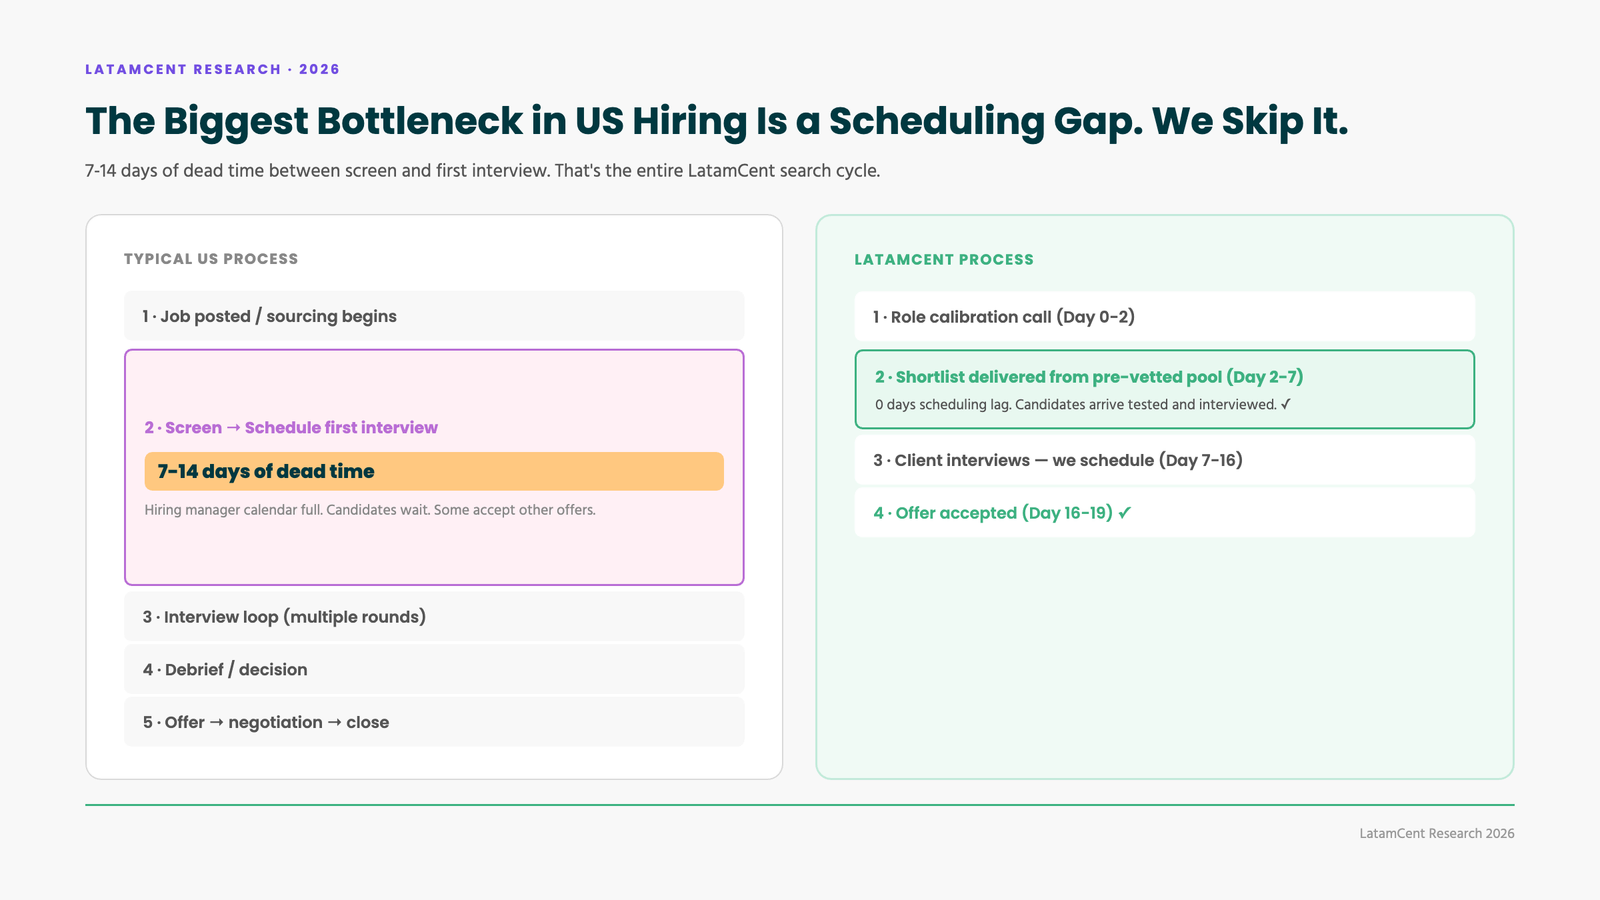
Now the LatamCent clock. Day 0-2: role calibration with the hiring manager. Day 2-7: shortlist delivered from an actively maintained, pre-vetted pipeline, English tested, LatamCent interview completed. Day 7-16: client interviews, a structured 4-5 step process we schedule and manage, which deletes the 7-14 day scheduling gap. Day 16-19: offer, negotiation, acceptance.
The pre-vetting is the unlock. The screening a US team spends three weeks on happens before your search starts, not during it.
The stage nobody talks about: offers that actually get accepted
Here is a failure mode that never shows up in time-to-fill dashboards: the 50-day search that ends with a declined offer and starts over at day zero. SHRM’s research shows a direct negative correlation between time-to-hire and offer acceptance, and the reason is simple: high performers get offers within 2-3 weeks of starting a search. Run a 45-day process and your finalist has already said yes to someone faster.
Our internal scorecard for the first half of 2026: 52 offers extended, 46 accepted. An 88% offer acceptance rate, including a March-through-May run of 28 consecutive offers accepted without a single decline.
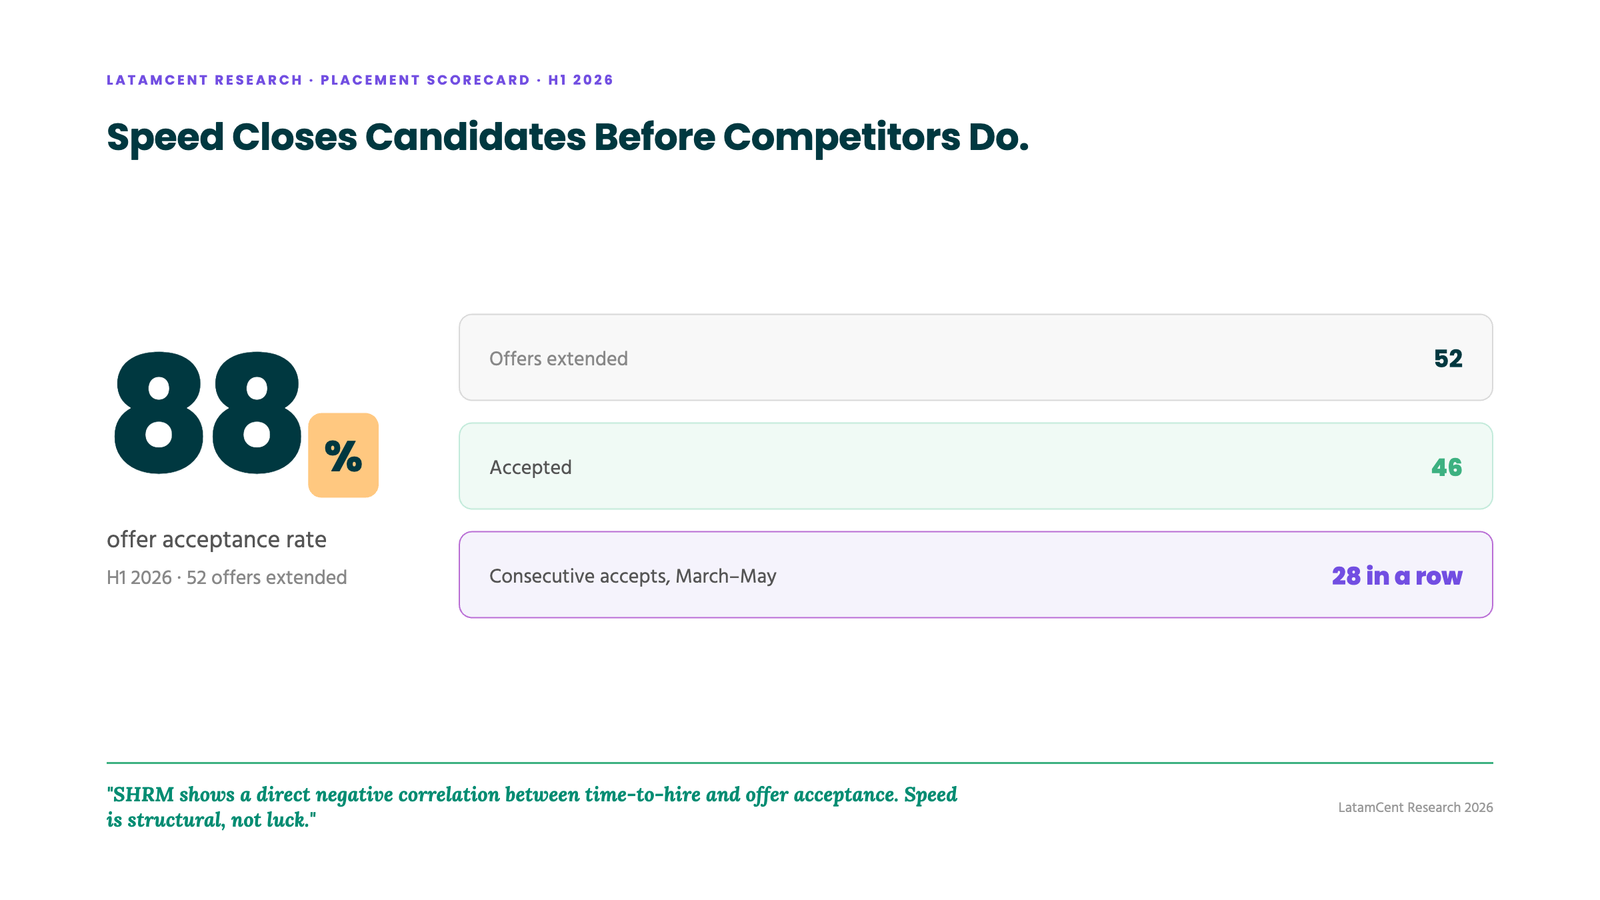
That number is not luck. It is two structural advantages. Speed: our finalists have not been sitting in a 6-week process collecting competing offers. And comp pre-alignment: expectations are set during vetting, before the first client interview, so the offer stage confirms a number instead of opening a negotiation.
The cost of the slow path
Run the math at SHRM’s own vacancy rates. A role filled in 19 days instead of 62 returns 43 extra days of output: at $500-$1,000 per day, that is $21k-$43k recovered per role, before recruiting fees. For revenue seats it is worse: an AE carrying a $1M annual quota represents roughly $83k of quota coverage per vacant month. A three-month AE search does not cost you a recruiting fee. It costs you a quarter of pipeline.
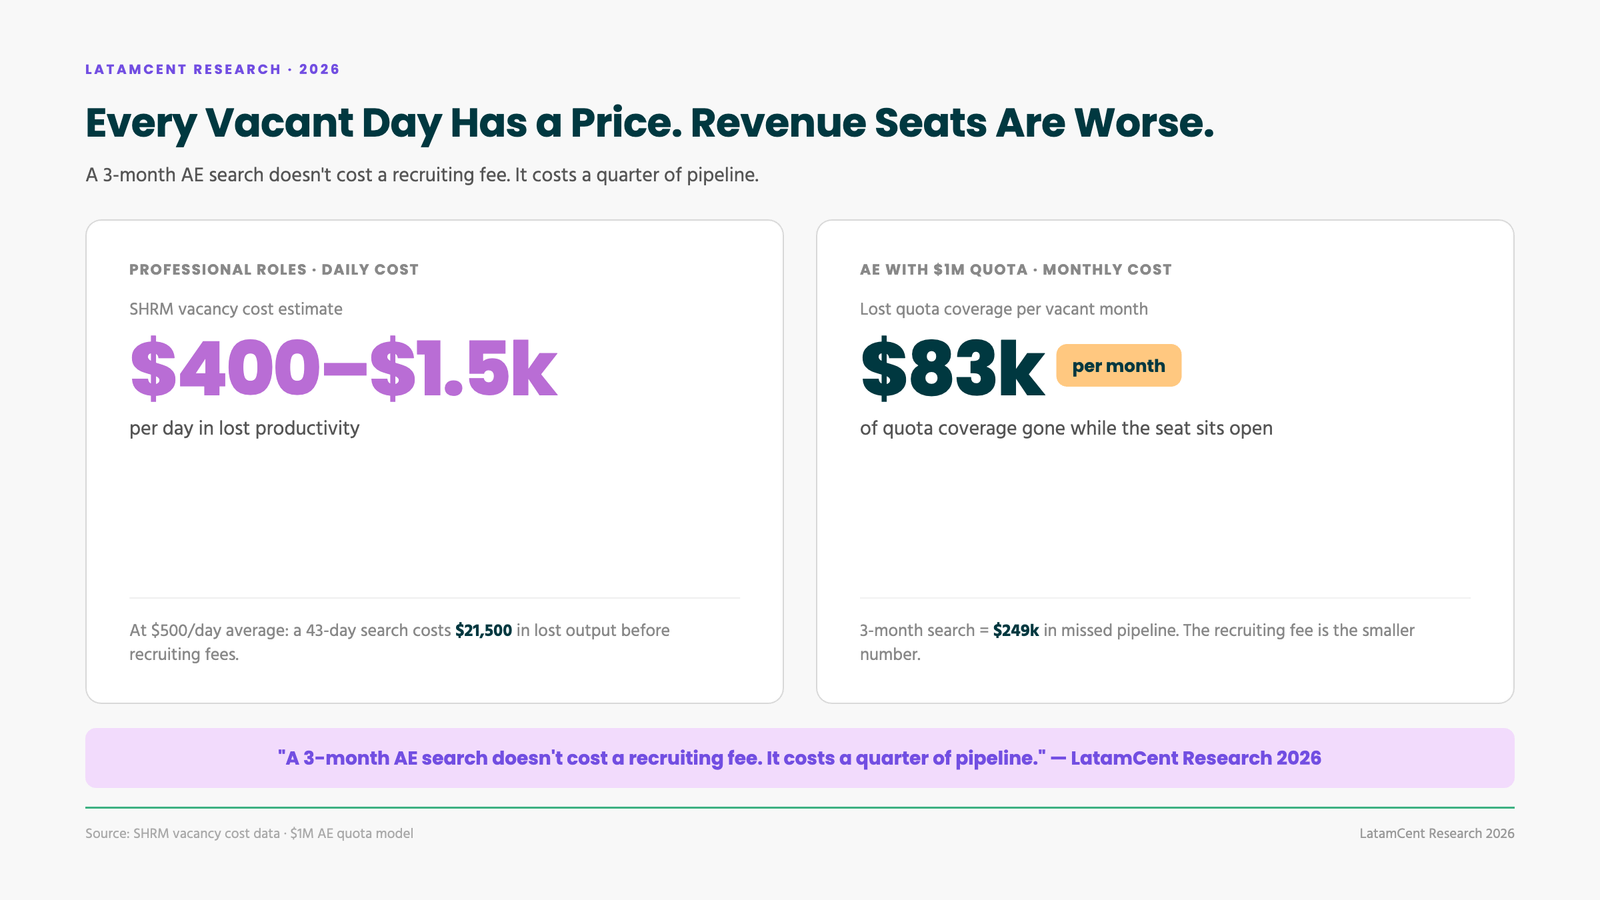
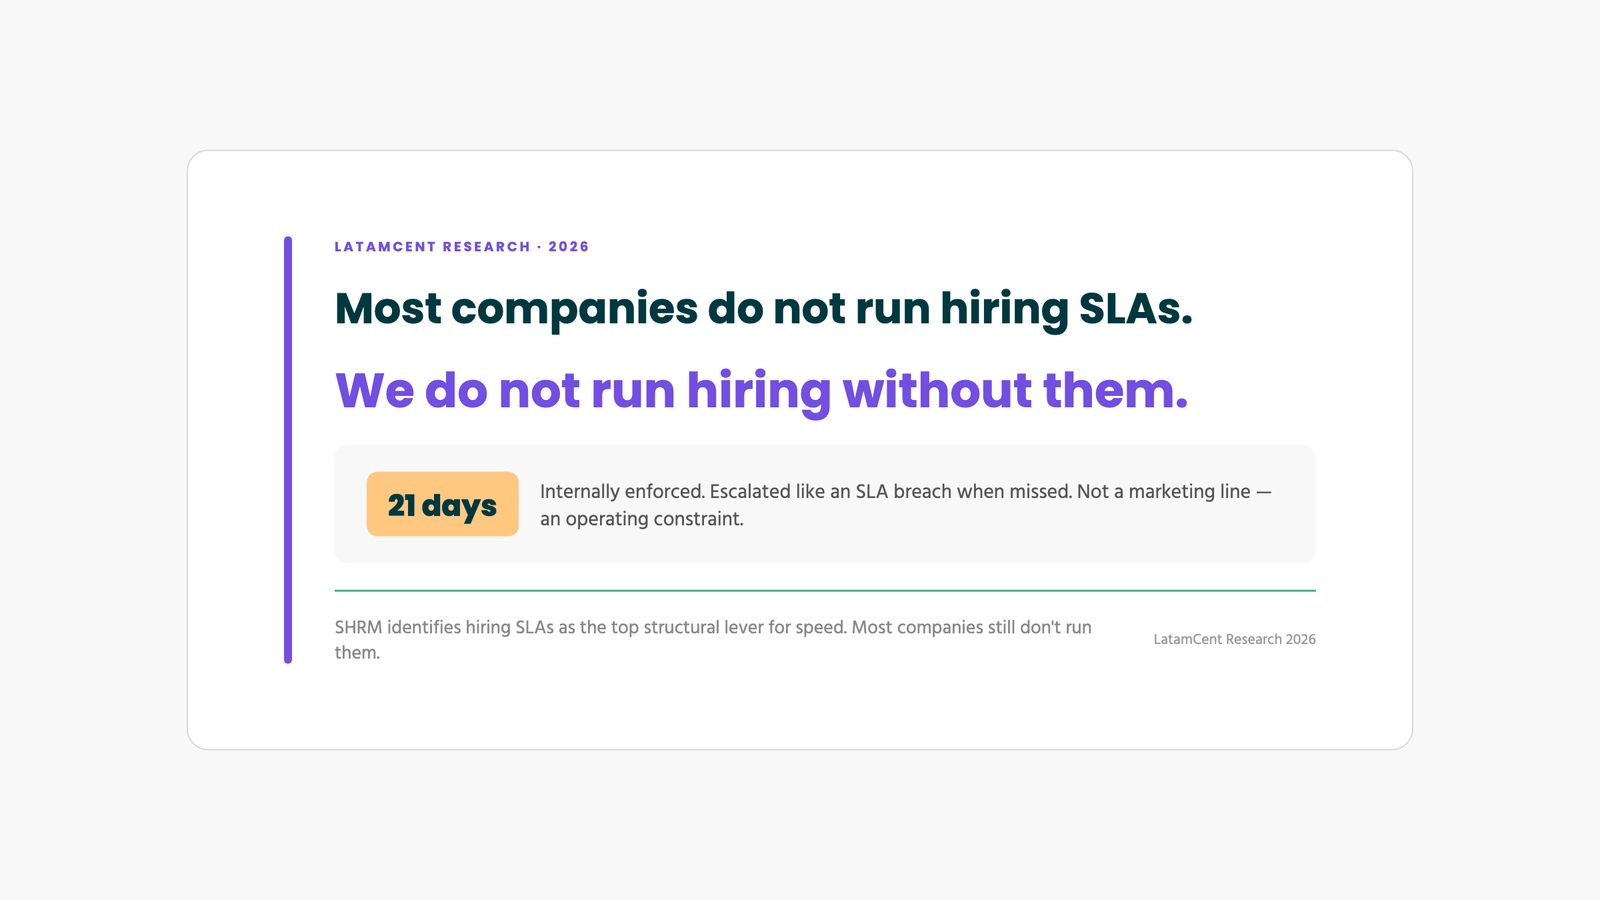
Multiply across a 5-role hiring plan and the slow path burns six figures before anyone signs an offer letter. This is why we treat the 21-day promise as an operating constraint, not a marketing line. Roles that drift past it get escalated internally the same way an SLA breach would, which is exactly the mechanism SHRM’s guidance identifies as the top structural lever for hiring speed. Most companies do not run hiring SLAs. We do not run hiring without them.
Methodology
LatamCent time-to-hire measured from client kickoff call to accepted offer for the placed candidate, drawn from LatamCent ATS records. This is intentionally not full application-to-start-date cycle time, which runs longer for every agency and internal team because it includes notice periods and administrative lag. Offer acceptance figures from LatamCent’s internal recruiting scorecard, H1 2026 (52 offers extended, 46 accepted). US benchmarks: SHRM Talent Acquisition Benchmarking data (42-44 day average, 24% increase since 2021, $400-$1,500 daily vacancy cost); LinkedIn Talent Insights (55-62 days for technology and engineering roles); Workable industry benchmarks; GoodTime 2026 Hiring Insights (60% of companies slower, interview volume up 42%). Median reported rather than mean to avoid distortion from outlier searches.
Have a role that has been open too long? Send us the JD. You will have a pre-vetted shortlist within a week and a signed hire in under 21 days, or we keep working at no additional cost. Book a free hiring call at latamcent.com.
This study is part of our Research & Insights series.
Cite this research
Found this useful? You are welcome to cite or link this study. Suggested citation:
LatamCent. "How Fast Can You Really Fill an AI & B2B SaaS Role? 19-Day Median (2026)" Research & Insights, LatamCent, 2026, https://latamcent.com/research-insights/how-fast-fill-saas-role/.