

LATAM teams share 7+ working hours per day with US teams. Offshore teams share 0-3. Research shows that gap drives a 22% delivery speed advantage and 31% higher code quality for teams with structured overlap, while offshore projects exceed budgets by 27-45% and lose up to 25% of initial savings to coordination overhead and rework.
Market trends | Based on LatamCent placement data, client migration patterns, and published outsourcing research | Last updated July 2026
Key findings
- LATAM teams share 7+ working hours per day with US teams; offshore shares 0-3.
- 70% of offshore projects exceed budget by 27-45%.
- Offshore teams take 4.6 months to reach 85% productivity, versus 1.8 months nearshore.
- Structured overlap drives 22% faster delivery and 31% higher code quality.
- Client satisfaction: 85% nearshore versus 70% offshore.
Offshore looked cheaper on the spreadsheet. Then the sprint retro happened. A blocker raised at 10am in Denver got answered at 11pm Denver time, and the fix landed the following afternoon. One question, two lost days. Multiply by a quarter.
I have watched clients arrive at LatamCent after exactly this experience. They did not leave offshore because of talent quality. India and Eastern Europe have excellent engineers. They left because of physics: the workday overlap between the US and Asia rounds to zero, and no process fixes a 10.5-hour offset.
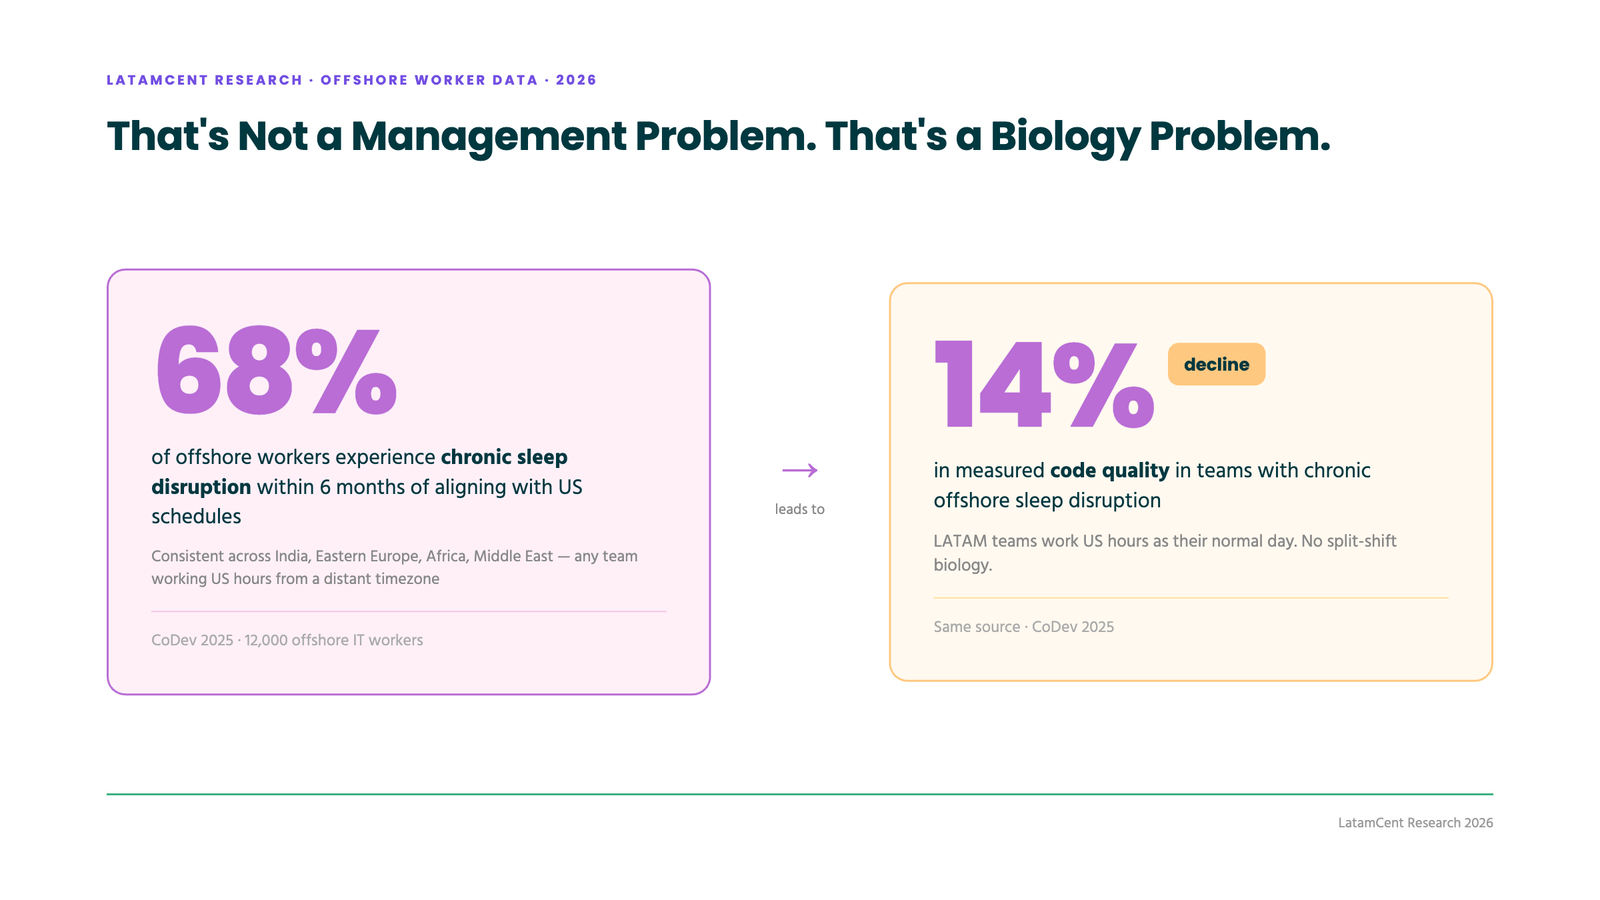
The research backs them up. A 2025 analysis of 12,000 offshore IT workers found that 68% experienced chronic sleep disruption within six months of aligning with US schedules, resulting in a 14% decline in code quality. That is not a management problem. That is a biology problem.
The comparison nobody puts in one table
| Factor | Nearshore (LATAM) | Offshore (South/Southeast Asia) | What the research says |
|---|---|---|---|
| Shared working hours with US teams | 7-9 hours/day | 0-3 hours/day | Teams spanning 3+ timezones: only 57% of communication happens in business hours, 43% outside |
| Timezone offset from US Eastern | 0-2 hours | 9.5-12.5 hours | 68% of offshore workers aligning to US hours report chronic sleep disruption within 6 months |
| Sticker rate vs US | ~45-55% of US comp | ~25-40% of US comp | Offshore wins on paper by 20 points |
| TCO after coordination overhead | ~50% of US | ~55-65% of US after rework and management | 70% of offshore projects exceed budget by 27-45%. Coordination overhead erodes up to 25% of initial savings |
| Ramp time to full productivity | 2-4 weeks | 4.6 months average to 85% productivity; full parity at 7-8 months | Onshore/nearshore: 1.8 months. Offshore: 4.6 months. That is 3 months of partial output |
| Delivery speed | 30% faster time-to-market vs offshore | Baseline | Nearshore TCO favors over offshore due to 30% faster delivery and 15-20% less rework |
| Code quality | 31% higher with structured protocols | Rework consumes 15-30% of total development effort | Poorly managed offshore: QA adds 15-25% to development costs |
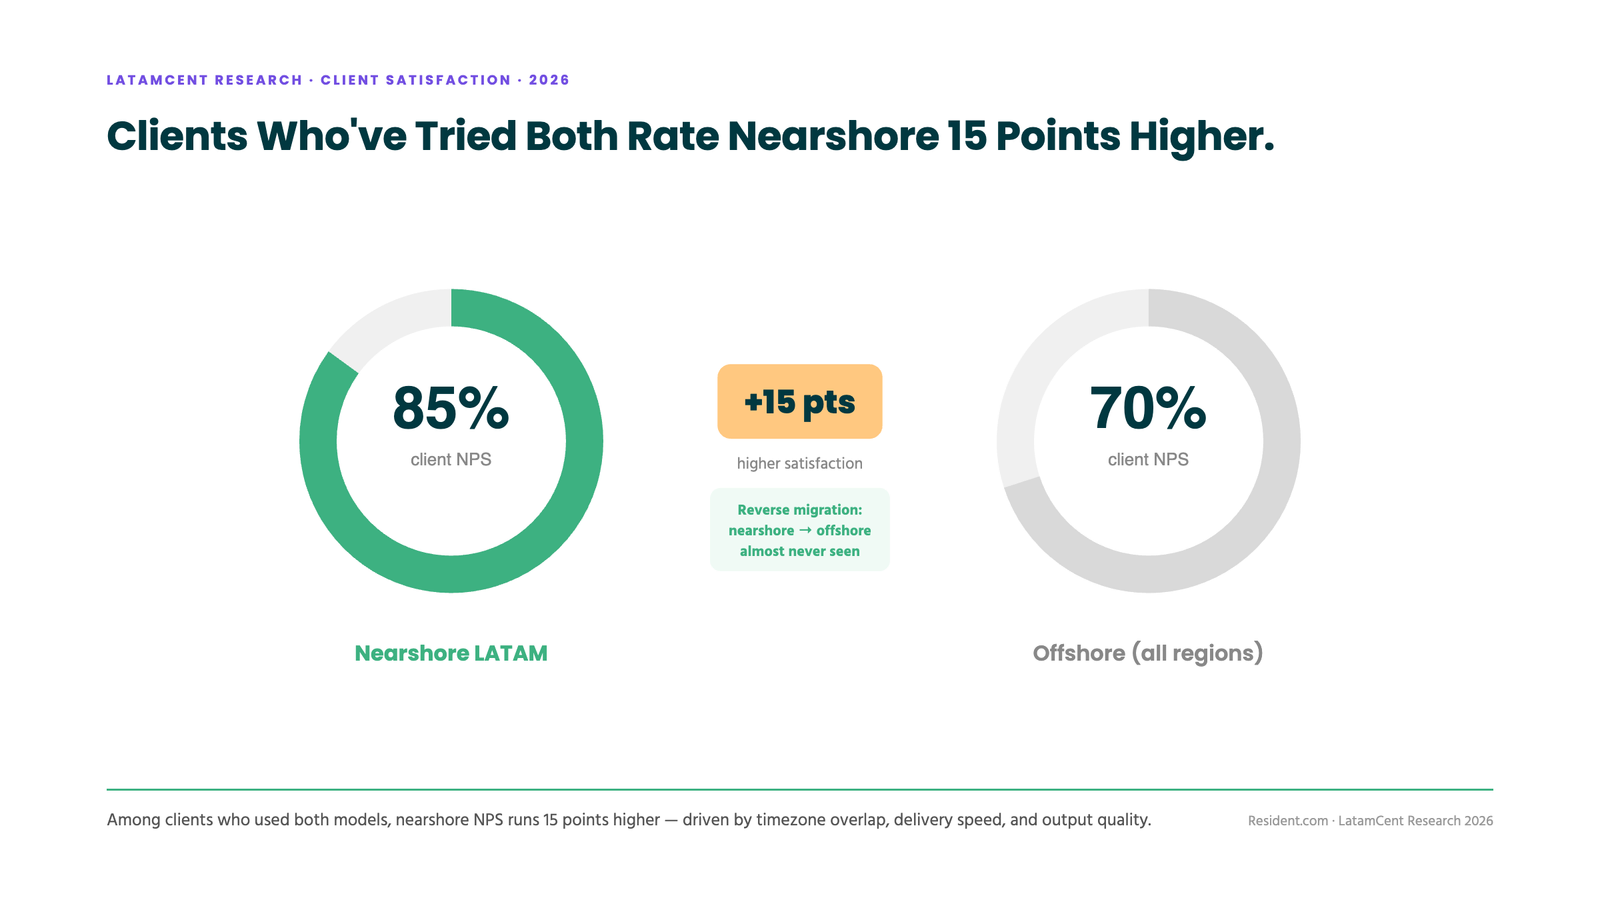
| Client satisfaction (NPS) | 85% | 70% | Nearshore NPS 15 points higher across client surveys |
| Talent churn | Industry standard | 25% annual churn rate | Offshore volume advantage offset by higher turnover |
| English proficiency in vetted pools | C1+ standard in top decile | Varies widely by market | 92% of LatamCent-submitted candidates score C1+ |
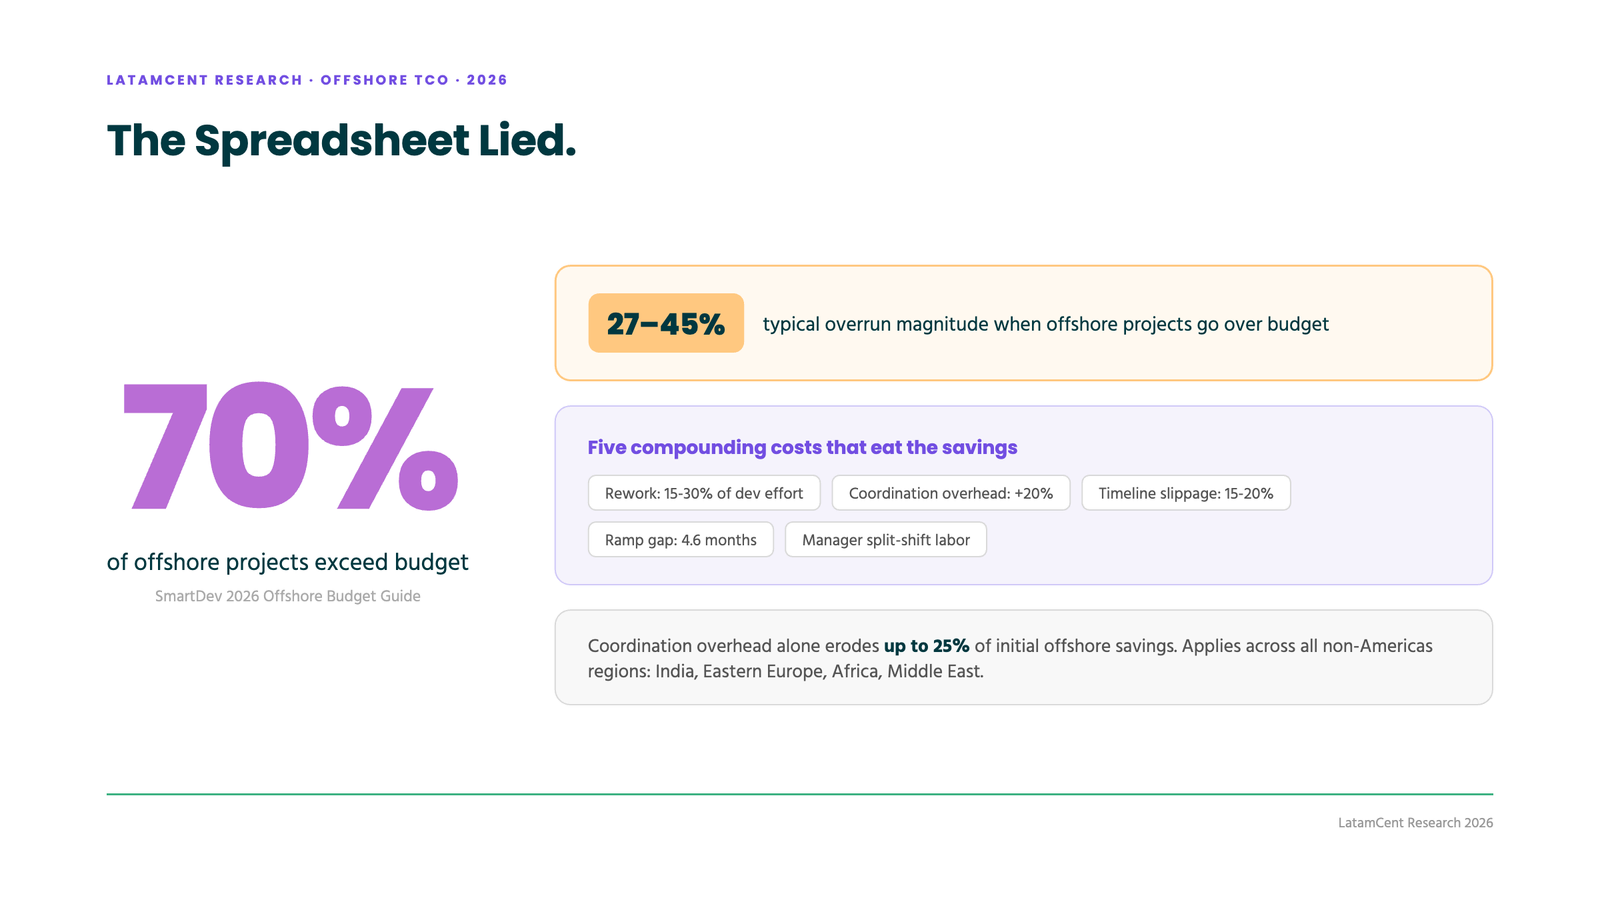
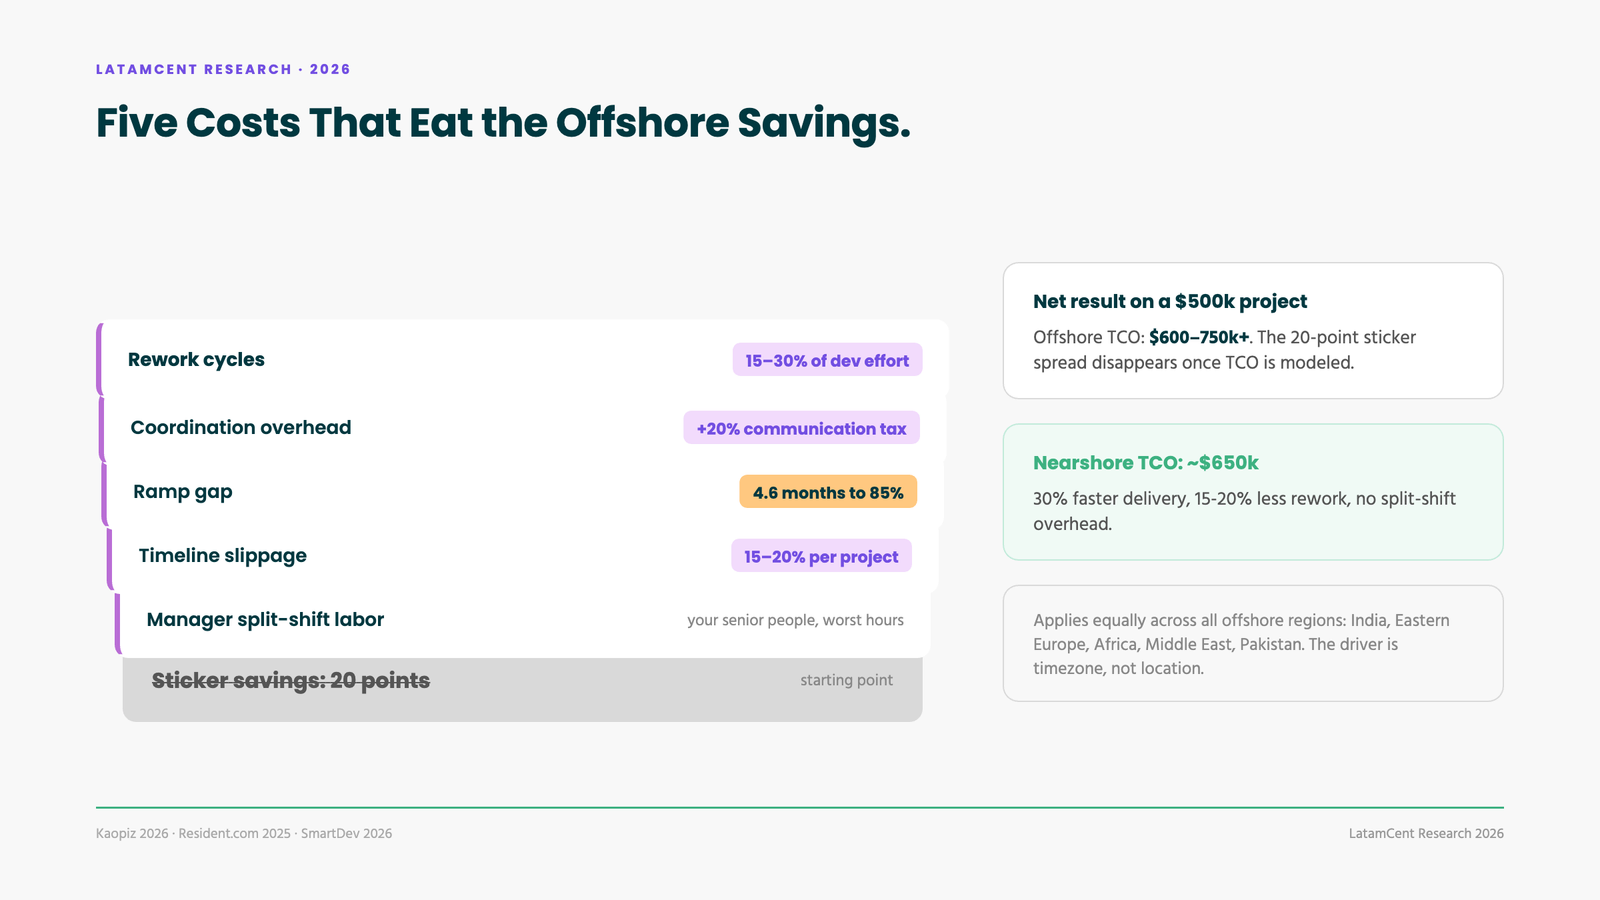
The row that matters most is TCO (total cost of ownership), not sticker rate. Offshore’s 20-point rate advantage gets consumed by five compounding costs: rework cycles (15-30% of dev effort), coordination overhead (20% communication tax on every offshore project), extended ramp time (4.6 months vs 1.8 months to reach productivity), timeline slippage (15-20% per project), and manager split-shift labor. Once you price the drag, nearshore costs less and ships faster.
The ramp gap nobody budgets for
This number alone should change every build-vs-buy analysis: offshore teams take an average of 4.6 months to reach 85% productivity and 7-8 months to reach full parity with an onshore team. Nearshore teams ramp in 1.8 months.
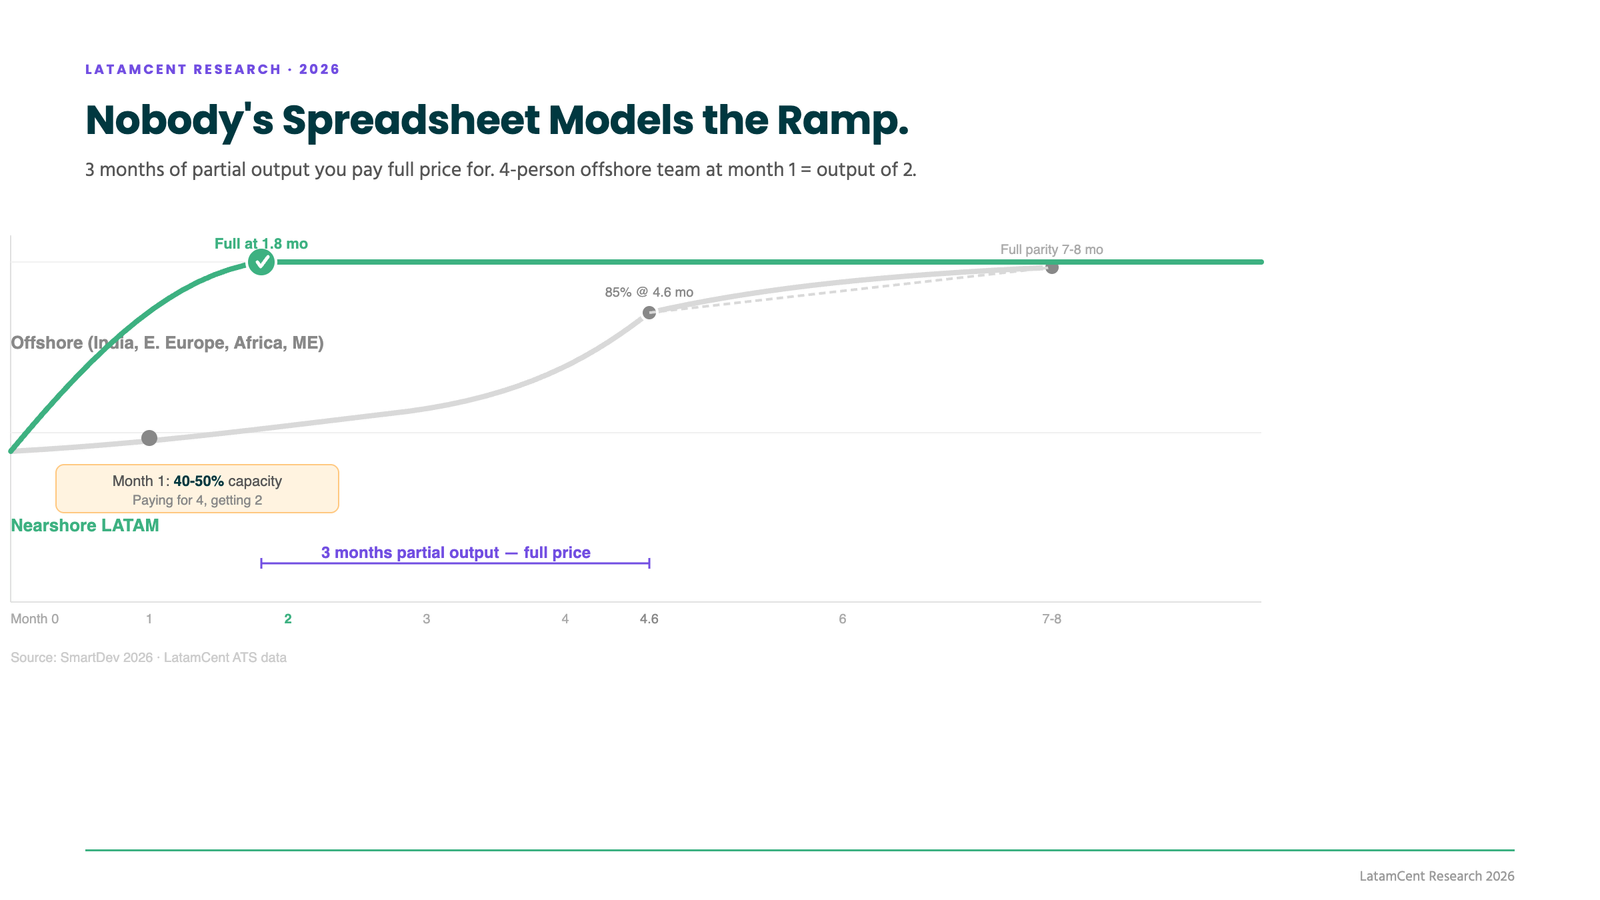
For a 4-person offshore team, first-quarter ramp costs run $8,000-$15,000 in direct overhead, before counting the output gap. At month one, expect 40-50% of planned capacity. That means for the first quarter, you are paying for four engineers and getting the output of two. The sticker savings on your spreadsheet assumed four productive engineers from day one. Nobody’s spreadsheet models the ramp.
Async is real. It is also not free.
The counterargument is always “we run async, timezone doesn’t matter.” Research says otherwise: in teams spanning three or more timezones, 43% of communication happens outside standard business hours. That is not async by choice. That is async by exhaustion.
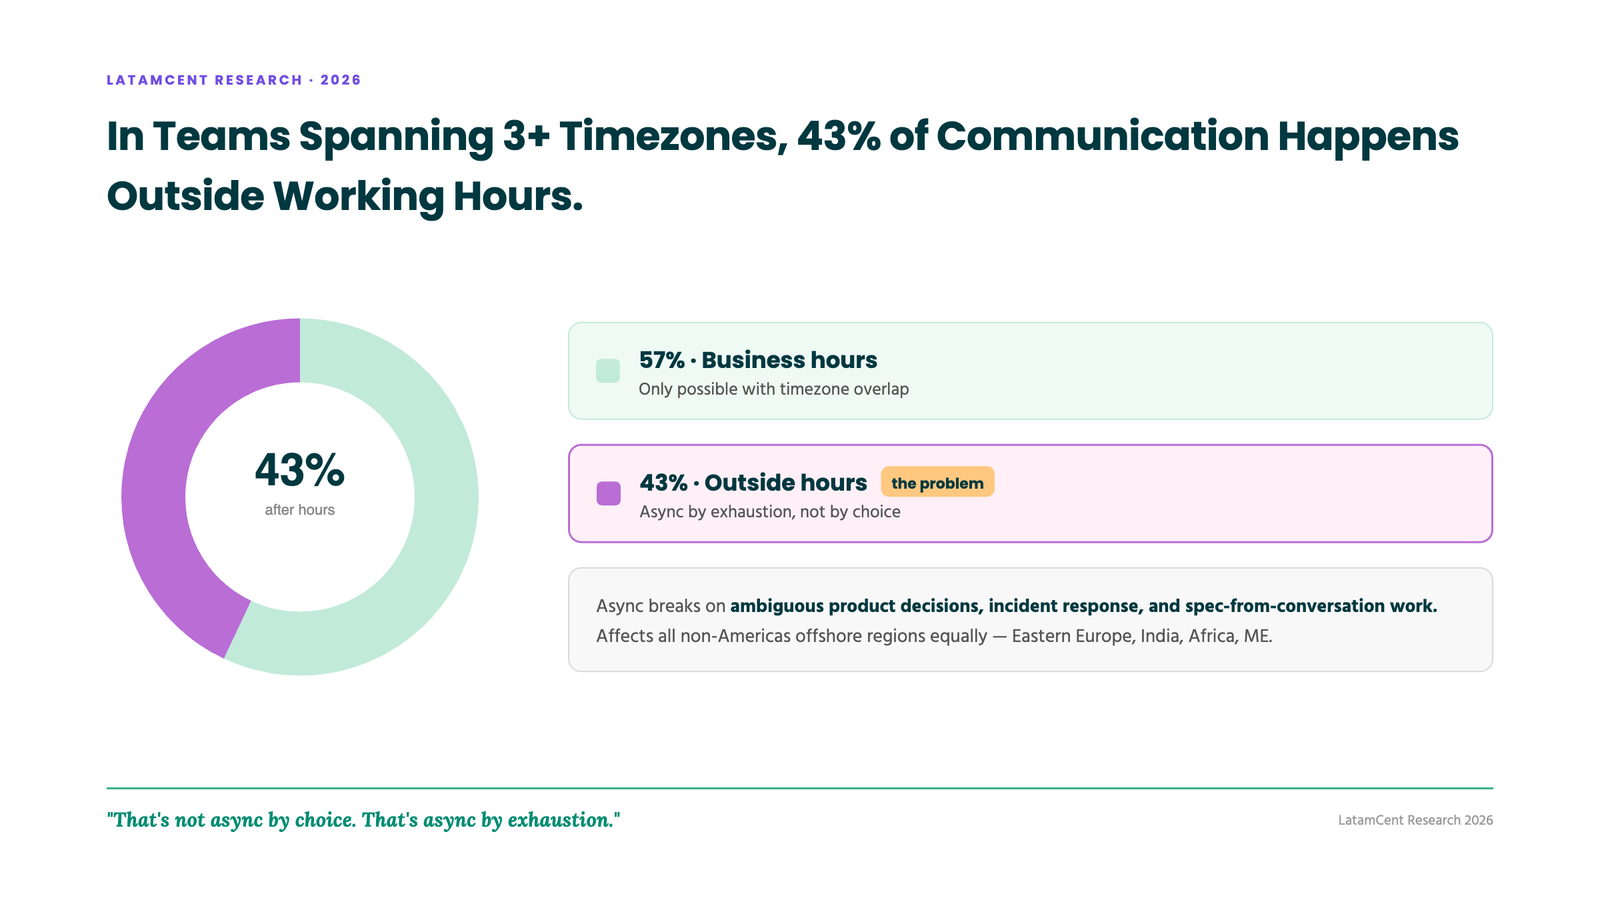
Async works for well-specified, decomposed work. It breaks on exactly the work that matters most at an AI & B2B SaaS company: ambiguous product decisions, incident response, sales engineering, anything where the spec emerges from conversation. The 2am production incident does not wait for a Notion doc.
Companies with structured management protocols (clear SLAs per stage, protected overlap windows, documented handoffs) achieve 22% faster delivery and 31% higher code quality than ad-hoc coordination. The question is whether you want to build that management layer yourself or hire talent that does not need it because they are already working your hours.
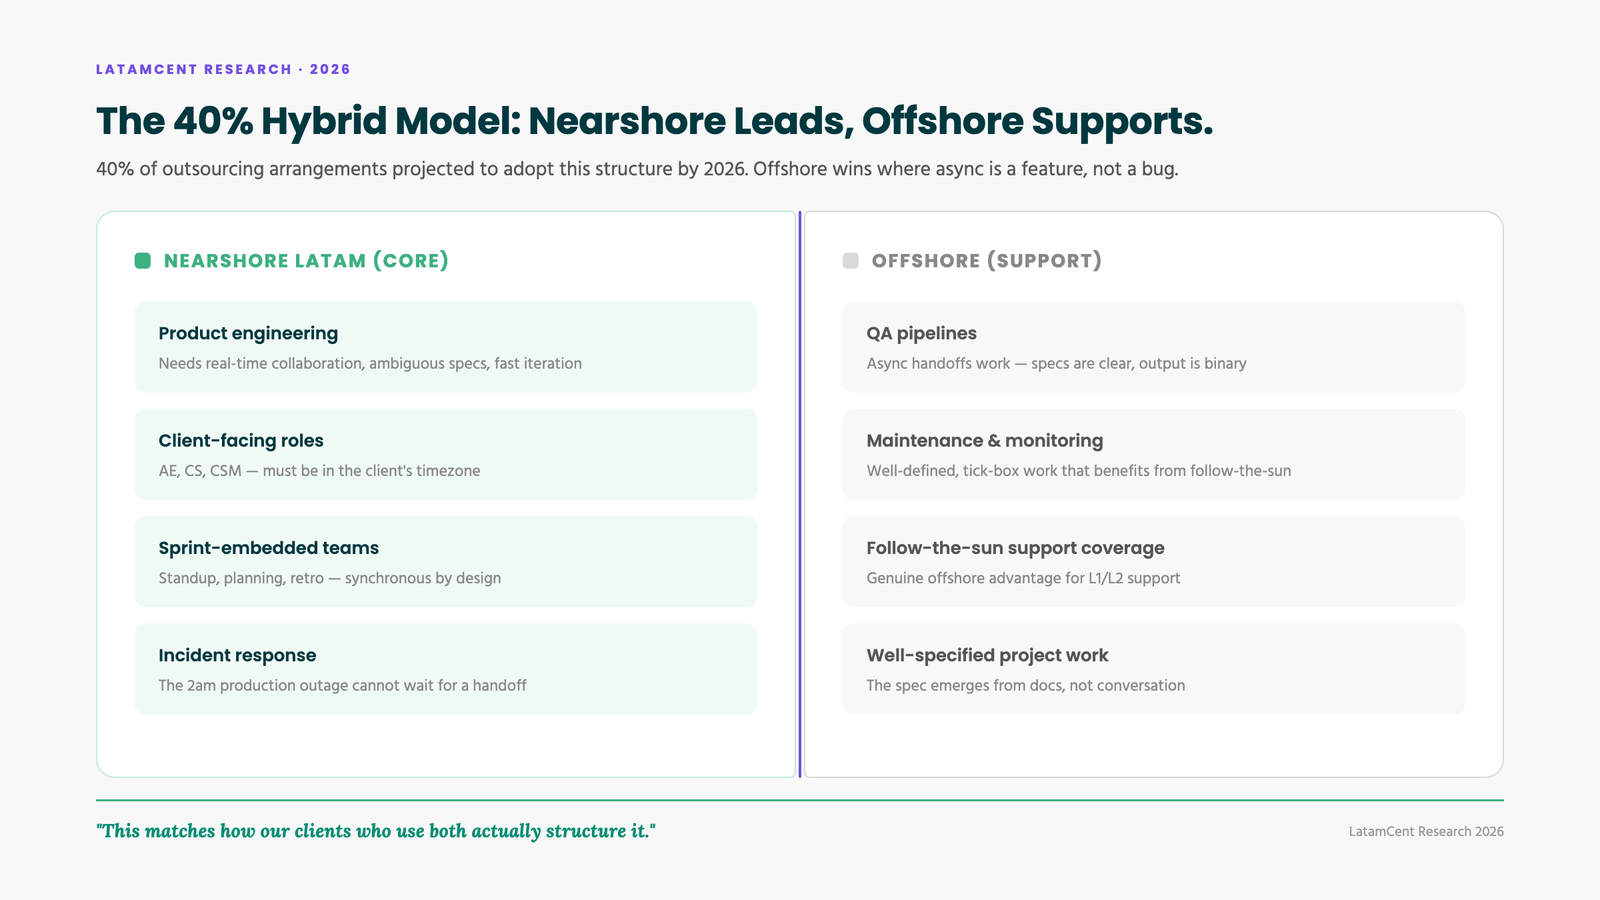
Follow-the-sun is a genuine offshore advantage for support coverage and QA pipelines. If that is your use case, offshore is the right call. For product engineering, GTM, and finance roles embedded in a US team’s daily rhythm, overlap wins.
The $500k project: real TCO comparison
Published analysis of a $500k development project breaks the cost reality into clear numbers. Nearshore TCO lands around $650k: the rate premium over offshore is offset by 30% faster delivery, 15-20% less rework, and no split-shift management overhead. Offshore TCO on the same project: $600-750k+ after rework, QA additions (15-25% of dev cost), timeline slippage, and the 4.6-month ramp. The sticker spread was $100k. The delivered spread is negligible to negative.
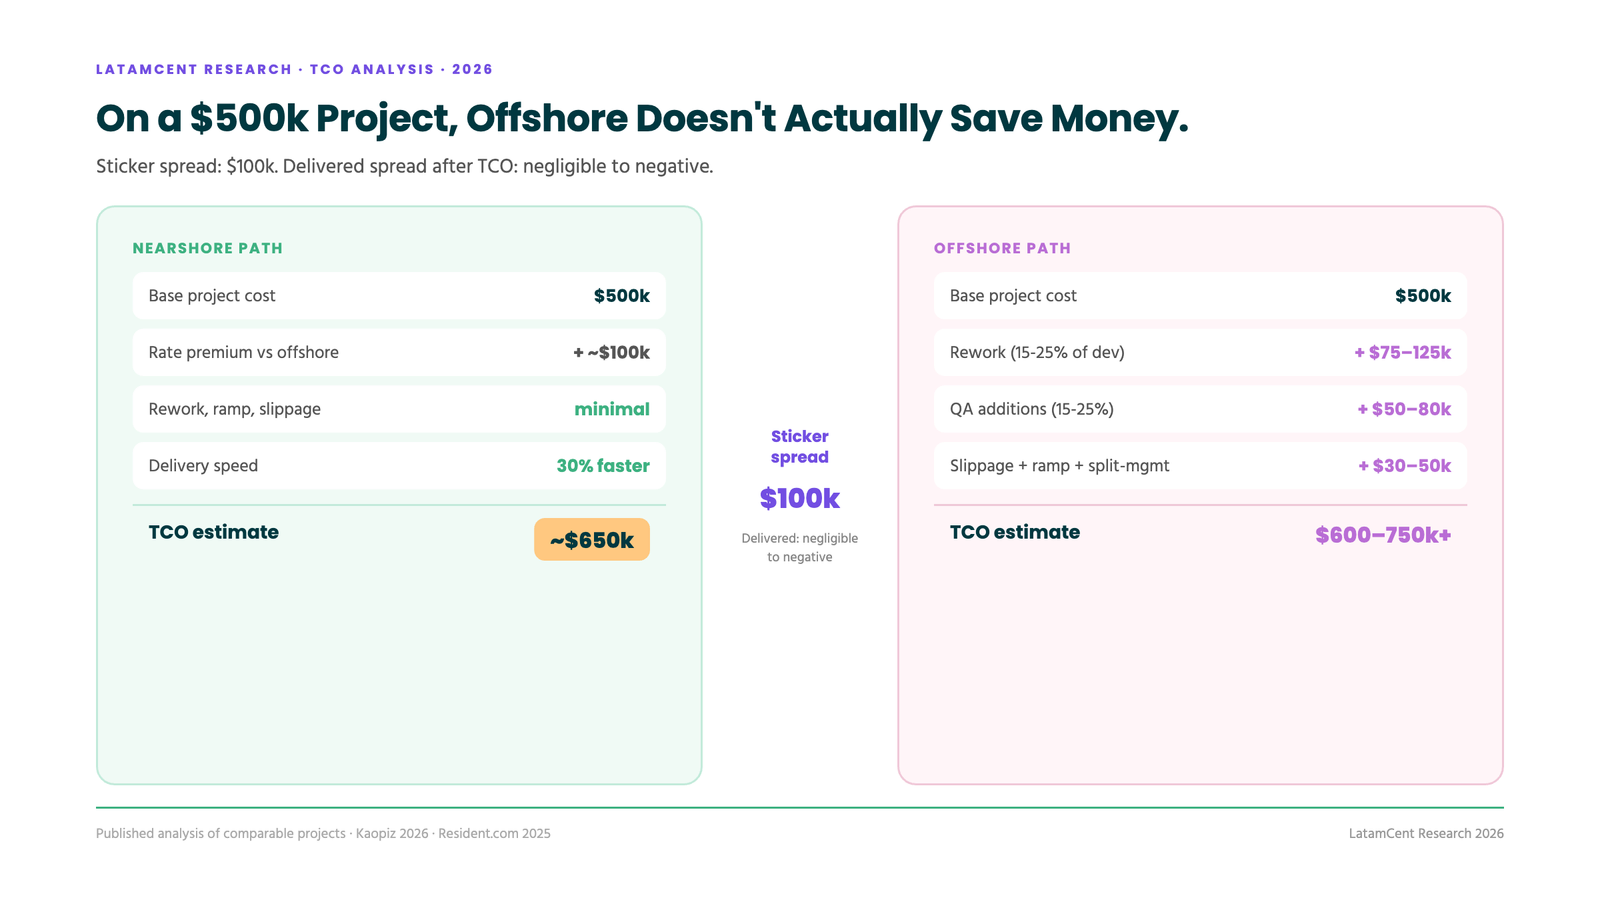
And that model does not count the cost your own team absorbs: engineering managers on split-shift calls, product managers writing 3× the documentation to compensate for async gaps, and senior engineers reviewing offshore code that needs refactoring before merge. Those hours come out of your most expensive people’s capacity.
What the migration pattern shows
Among our client base, the most common origin story is not “first international hire.” It is “second attempt.” Companies that tried offshore for embedded product roles and moved the function nearshore. The reverse migration, nearshore to offshore, we almost never see for team-embedded roles. Markets vote with repeat behavior, and the NPS data confirms it: 85% nearshore vs 70% offshore across published client surveys.
The hybrid model is growing. Industry projections show 40% of outsourcing arrangements adopting a nearshore-lead, offshore-support structure by 2026: nearshore for core product engineering and client-facing roles, offshore for maintenance, QA, and well-specified project work. That split makes sense, and it matches how our clients who also use offshore teams actually structure the work.
Methodology
Timezone overlap calculated from standard business hours across major LATAM hubs (Mexico City, Bogota, Medellin, Sao Paulo, Buenos Aires) against US Eastern and Pacific. Cost and TCO figures from LatamCent placement data, published offshore rate benchmarks, and outsourcing industry analyses. Offshore hidden cost data: 70% budget overrun rate and 27-45% overrun magnitude from industry research cited in SmartDev‘s 2026 offshore budget guide; ramp time (4.6 months to 85%, 7-8 months to parity) from the same source; rework consuming 15-30% of dev effort from Kaopiz 2026 hidden cost analysis; 20% communication overhead for offshore from Resident.com 2025 nearshore-vs-offshore comparison; 22% faster delivery and 31% higher code quality with structured protocols from CoDev 2025 analysis of peer-reviewed and industry case studies; offshore worker sleep disruption (68% within 6 months, 14% code quality decline) from CoDev 2025 analysis of 12,000 offshore IT workers; NPS differential (85% vs 70%) from Resident.com client survey data; offshore talent churn at 25% from Resident.com. Client migration patterns from LatamCent intake data.
Stop managing a team you only see in recorded standups. LatamCent places pre-vetted LATAM talent working your hours, in your Slack, in your sprint. Book a free hiring call at latamcent.com and meet candidates who are awake when you are.
This study is part of our Research & Insights series.
Cite this research
Found this useful? You are welcome to cite or link this study. Suggested citation:
LatamCent. "Nearshore vs Offshore: The Data on Timezone Overlap & Cost" Research & Insights, LatamCent, 2026, https://latamcent.com/research-insights/nearshore-vs-offshore-data/.